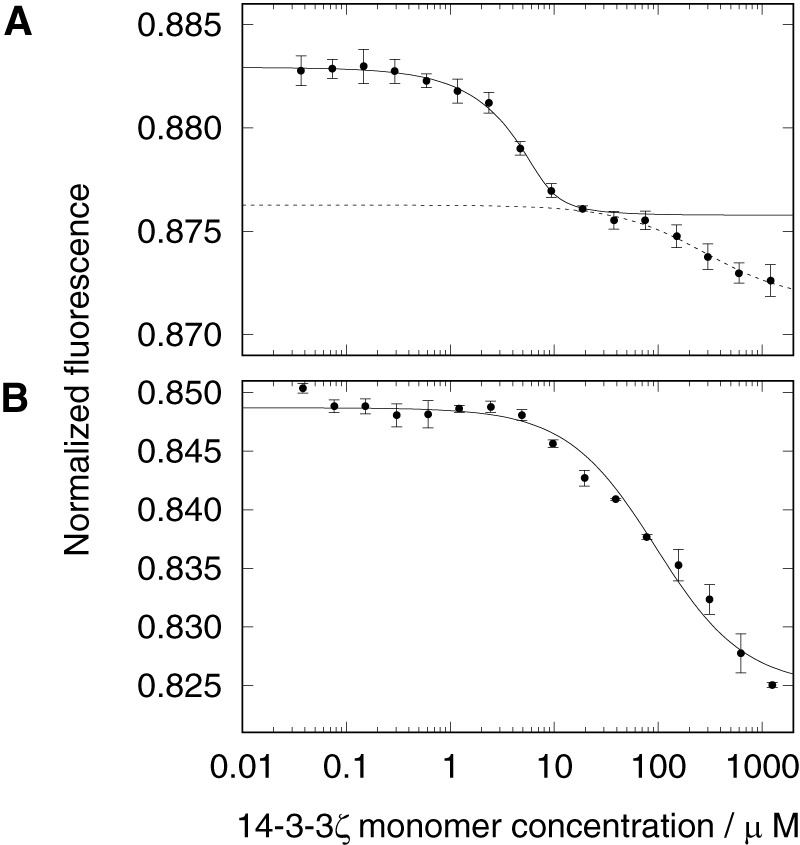
Figure 6.

Microscale thermophoretic analysis of interaction between 5μm E52C/C348S MAP2c and 14-3-3ζ in 50 mm Tris buffer. A, unphosphorylated MAP2c; B, phosphorylated MAP2c. The plots show interactions in the 14-3-3ζ monomer concentration range from 36.6 nm to 1.2 mm. The mean values ± S.D. for each concentration point were calculated from triplicate measurements.
