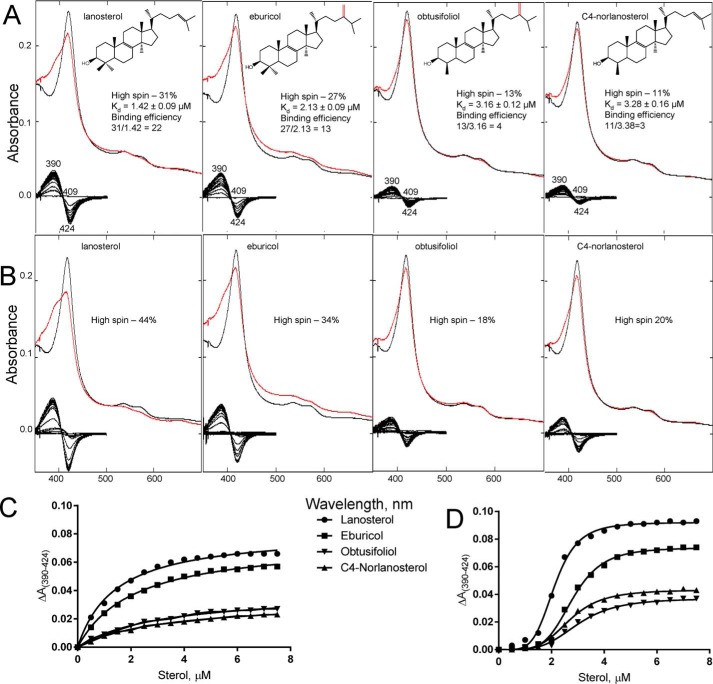
Figure 4.
Spectral response of C. albicans CYP51 to the addition of the sterol substrates. Type 1 shift (red line) in the absorbance spectra of C. albicans CYP51 (1.9 μm) upon titration with the four CYP51 sterol substrates is shown. Absolute (top) and difference (bottom) absorbance spectra are shown. A, titration under standard substrate titration conditions (50 mm potassium phosphate buffer (pH 7.4), containing 200 mm NaCl and 0.1 mm EDTA). B, in the presence of 0.1% Triton X-100 (v/v). The titration range was 0.5–7 μm; the titration step was 0.5 μm, and the optical path length was 1 cm. C, titration curves of A; D, titration curves from B. The high-spin form content (the portion of the substrate-bound CYP51 molecules) and the apparent Kd values were calculated as described under “Experimental procedures.”

