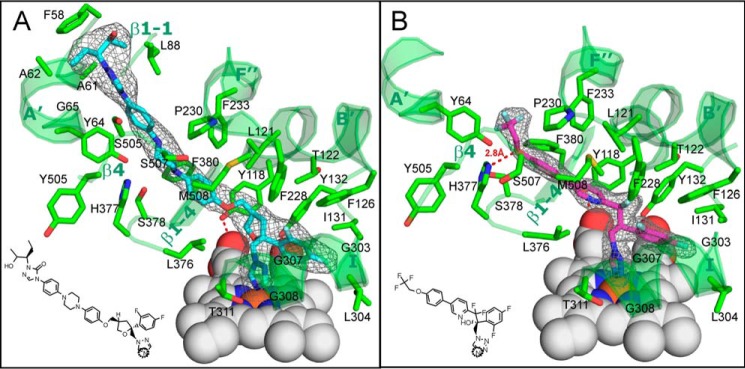
Figure 9.
Posaconazole and VT-1161 bound in the C. albicans CYP51 active site. The 2Fo − Fc omit electron density maps (gray mesh) of posaconazole (cyan) and VT-1161 (magenta) are contoured at 1.2 and 1.5 σ, respectively. A, posaconazole; B, VT-1161. The inhibitor contacting residues (within 4.5 Å, stick representation) and the corresponding secondary structural elements (ribbon representation) of C. albicans CYP51 are depicted in green and marked (see also Table 2). The heme is depicted as gray spheres. H-bonds are shown as red dashes. The heme-coordinating nitrogen atoms in the structural formulas of the inhibitors are circled.

