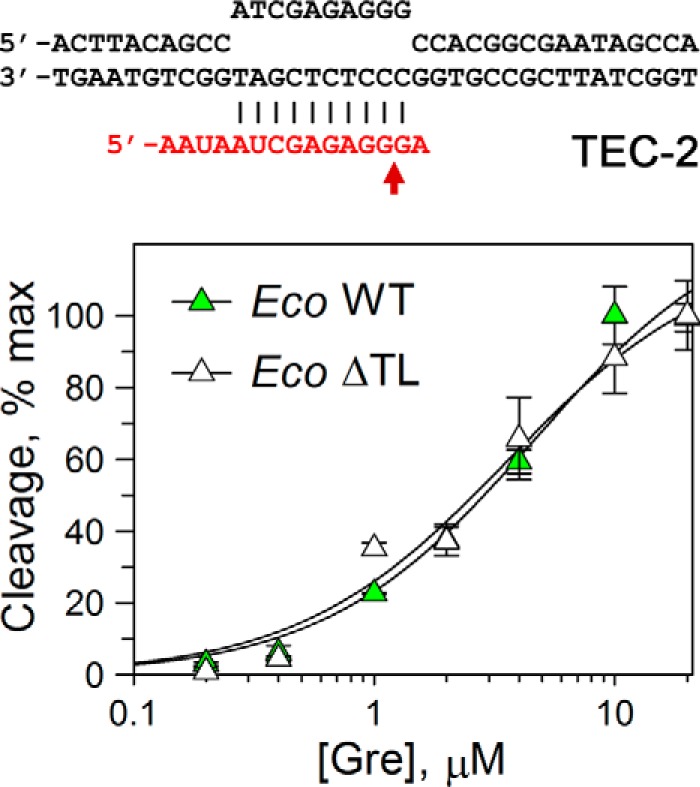
Figure 5.

Comparison of apparent GreA affinities to WT and ΔTL Eco RNAPs. The reactions were performed in TEC-2 at 0 °C (to make the measurements possible by manual mixing) for 1 min for WT RNAP and for 10 min for ΔTL RNAP; under these conditions the reactions did not go to completion, and <20–30% of active TECs reacted even at maximal GreA concentration. For each RNAP, the data were normalized relative to the maximal RNA cleavage measured at high GreA concentration. The data were fitted to a hyperbolic equation.
