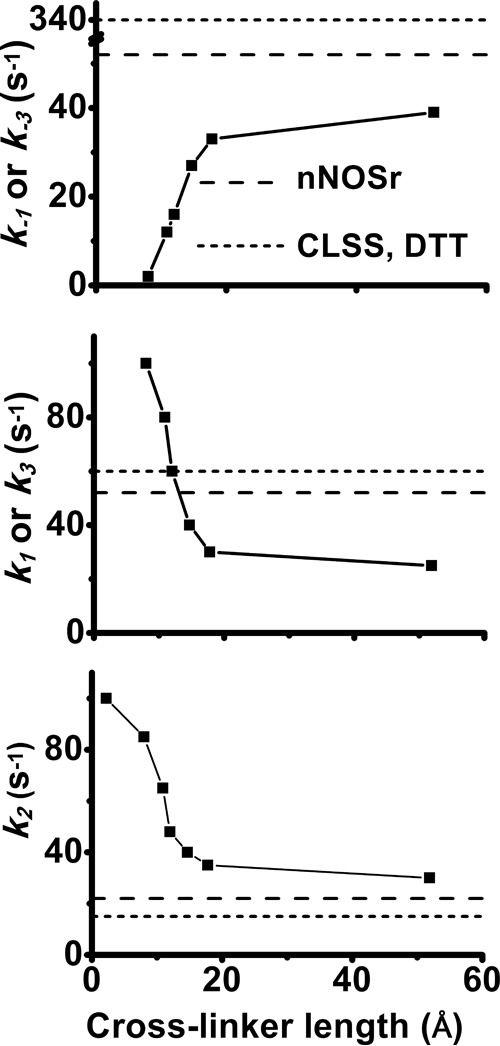
Figure 12.

Effect of cross-linker length on the best fit rates of conformational change and interflavin ET in CLSS. Rate values were derived from the simulations of the cytochrome c traces in Fig. 9 as explained in the text. Upper and middle panels, rates of conformational opening and closing, respectively. Lower panel, rate of interflavin ET. For comparison, dashed and dotted lines are included in each panel that indicate values determined for nNOSr and free CLSS.
