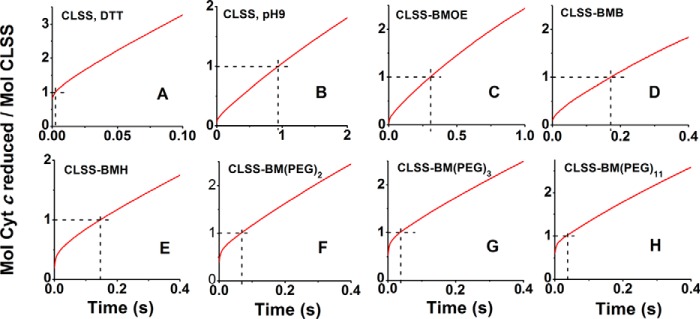
Figure 9.
Stopped-flow traces of cytochrome c reduction by the various free and cross-linked CLSS proteins. Each fully reduced protein was mixed with excess cytochrome c at 10 °C under anaerobic conditions, and the reduction was monitored versus time at 550 nm. Horizontal and vertical dashed lines indicate the absorbance change and time elapsed during the reduction of 1 molar eq of cytochrome c by each protein. Data are representative of 5–7 trials.

