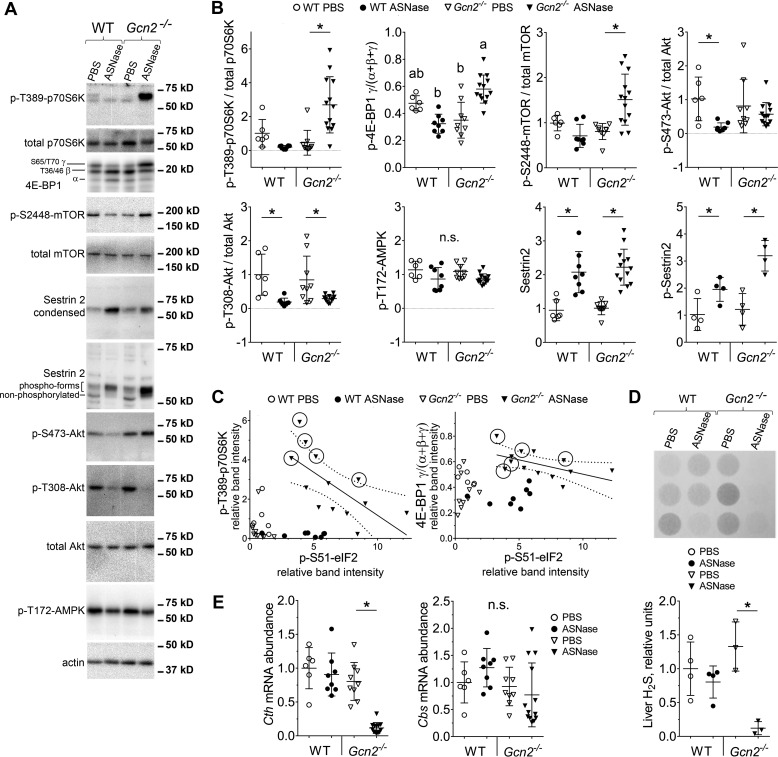
Figure 3.
GCN2 deletion hyperactivates mTORC1 during ASNase treatment of obese mice. Representative images of immunoblots (A) and quantitative analysis of relative band intensities (B) for key components of mTORC1 pathway in the livers of WT and Gcn2−/− mice treated with ASNase or PBS. C, scatter plots of individual data points showing inverse relationships between p-(S51)-eIF2 and p-(T389)-S6K and between p-(S51)-eIF2 and γ-4E-BP1 in the Gcn2−/− ASNase-treated group. Dotted lines represent 95% confidence interval for Pearson's linear correlation analysis. Circled markers demarcate mice that became prematurely moribund. D, hepatic hydrogen sulfide production as measured by lead acetate method. E, quantitative analysis of Cth and Cbs gene expression evaluated by quantitative RT-PCR. Data are mean ± S.D. *, p < 0.05 as compared with respective PBS control. Means not sharing a letter are different according to Tukey post hoc when drug X strain interaction was revealed by analysis of variance. n.s., no significant differences.

