Figure 2.
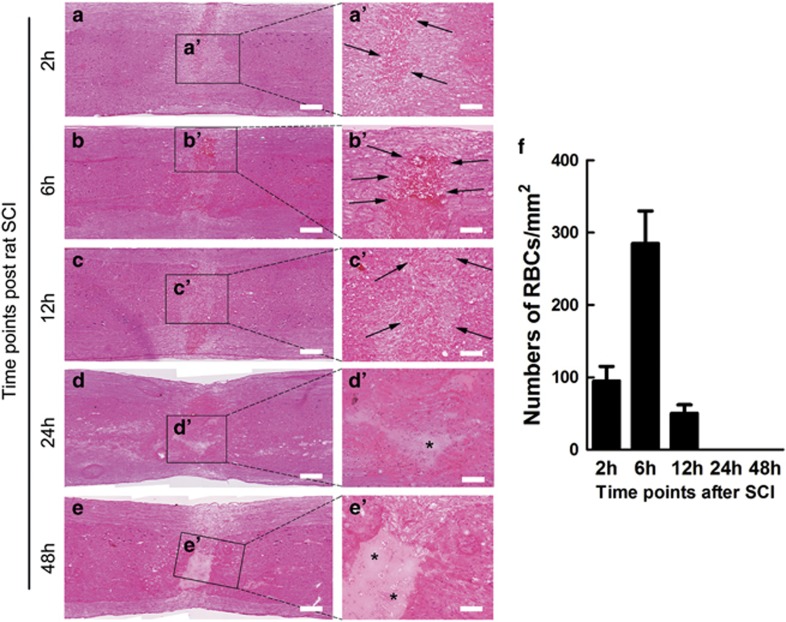
Duration of hemorrhage after SCC. (a–c) Numerous RBCs were observed at 2, 6 and 12 h after SCC. (d, e) None of RBCs were found at 24 and 48 h after SCC. Scale bars =200 μm. (a'–e') Higher-magnification pictures from the white boxes in corresponding pictures. Arrows show RBCs and asterisks indicate the lesion center. Scale bars =100 μm. (f) Quantification of the numbers of RBCs; n=3 per time point.

