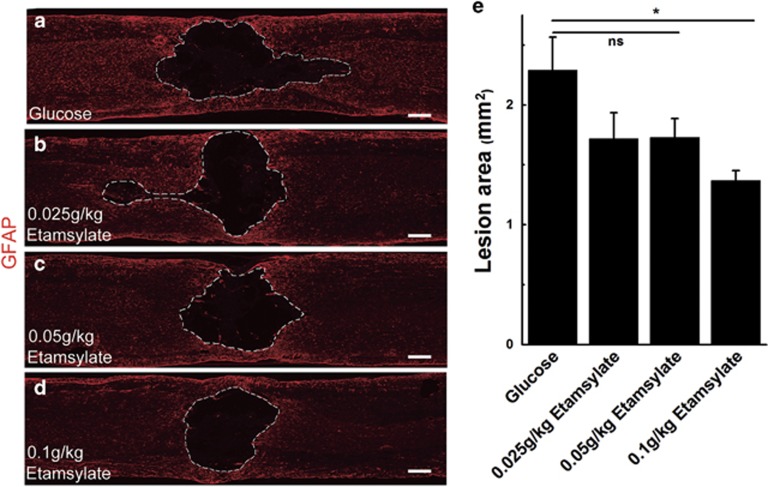
Figure 3.
A dose–response experiment with different concentrations of Etamsylate. (a–d) Dashed lines indicate the lesion boundary defined by GFAP-immunoreactive astrocytic scar in glucose (a), 0.025 g kg−1 (b), 0.05 g kg−1 (c) and 0.1 g kg−1 groups (d). Scale bars=300 μm. (e) Quantification of lesion area; n=6/group. *P<0.05.

