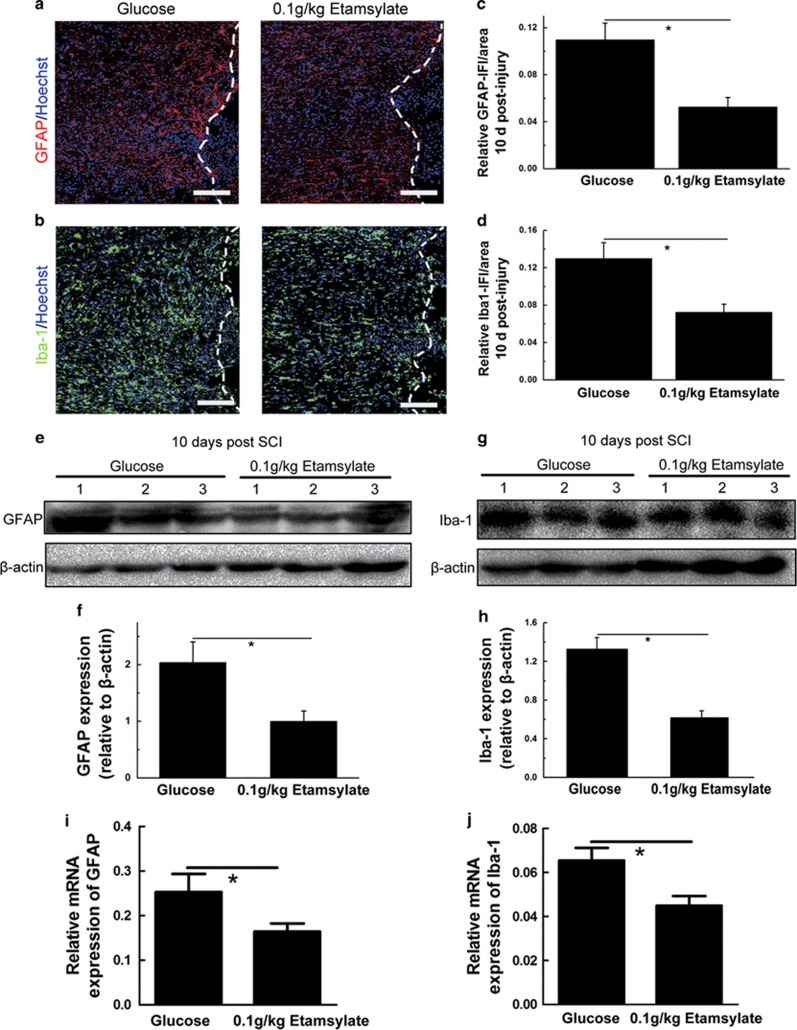
Figure 6.
Effects of Etamsylate on GFAP and Iba-1expression at 10 days after SCC. (a, b) GFAP and Iba-1 immunoreactivity in glucose control (a) and Etamsylate-treated group (b). (c, d) Quantification of the immunofluorescence intensity (IFI)/area of GFAP and Iba-1. Scale bars=100 μm; n=6/group. *P<0.05. (e, g) Western blots were probed for GFAP and Iba-1, and β-actin was used as a loading control. (f, h) Quantification of the expression of GFAP and Iba-1; n=3/group. *P<0.05. (i, j) Quantification of mRNA levels of GFAP and Iba-1; n=3/group. *P<0.05.

