Figure 7.
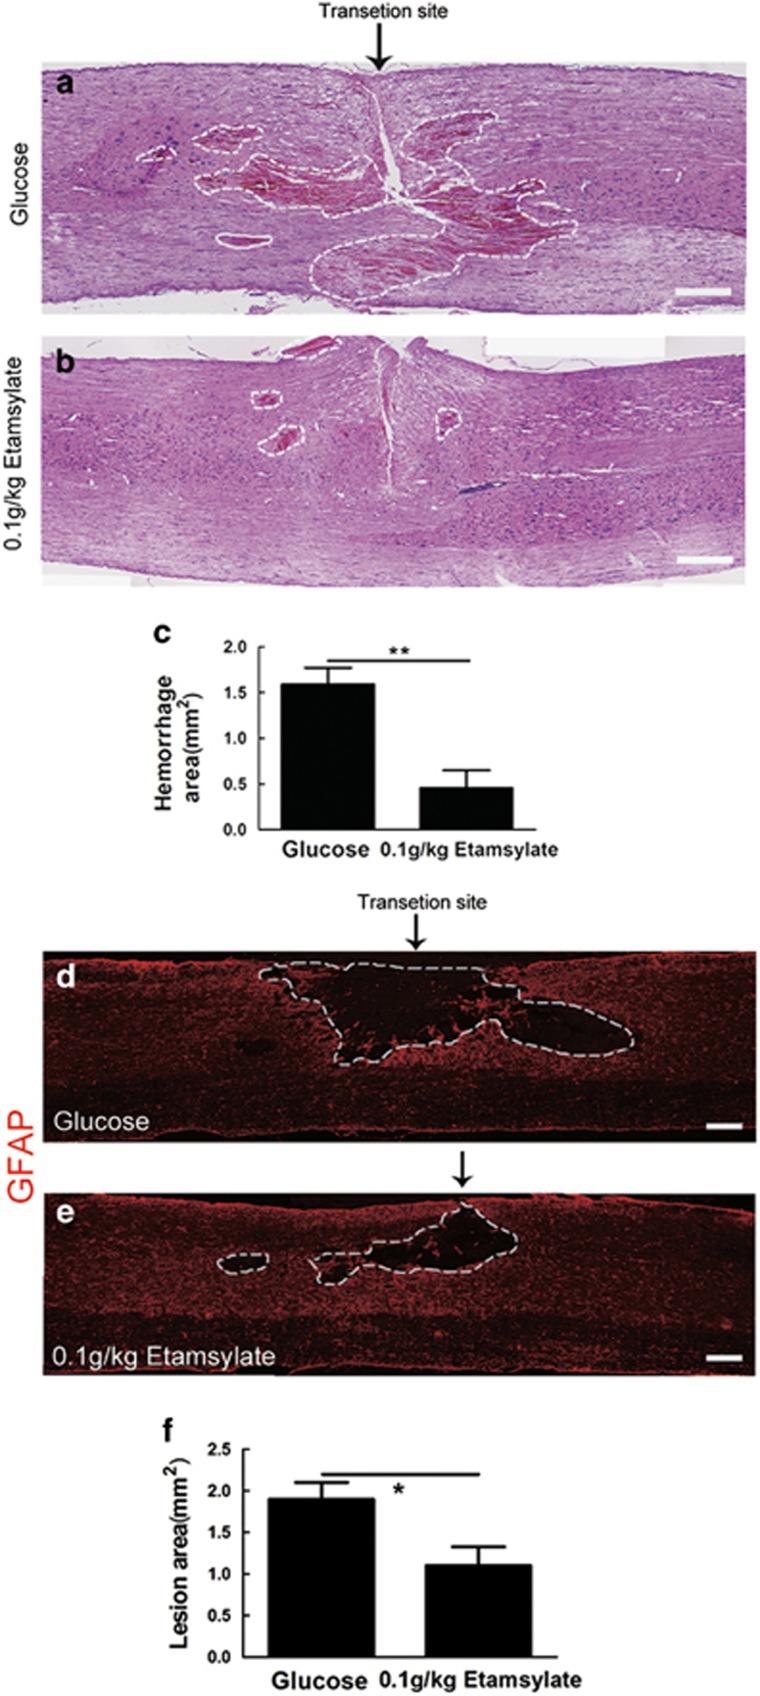
Reduction of hemorrhage and area of lesion cavity by Etamsylate after SCT. (a, b) Hemorrhage area in glucose control (a) and Etamsylate group (b). The arrow showed the transection site. Scale bars=400 μm. (c) Quantification of the hemorrhage area; n=5/group. **P<0.01. (d, e) Dashed lines indicate the lesion boundary defined by GFAP-immunoreactive astrocytes in glucose control (d) and Etamsylate group (e). Scale bars=300 μm. (f) Quantification of lesion area; n=5/group. *P<0.05.

