Figure 1.
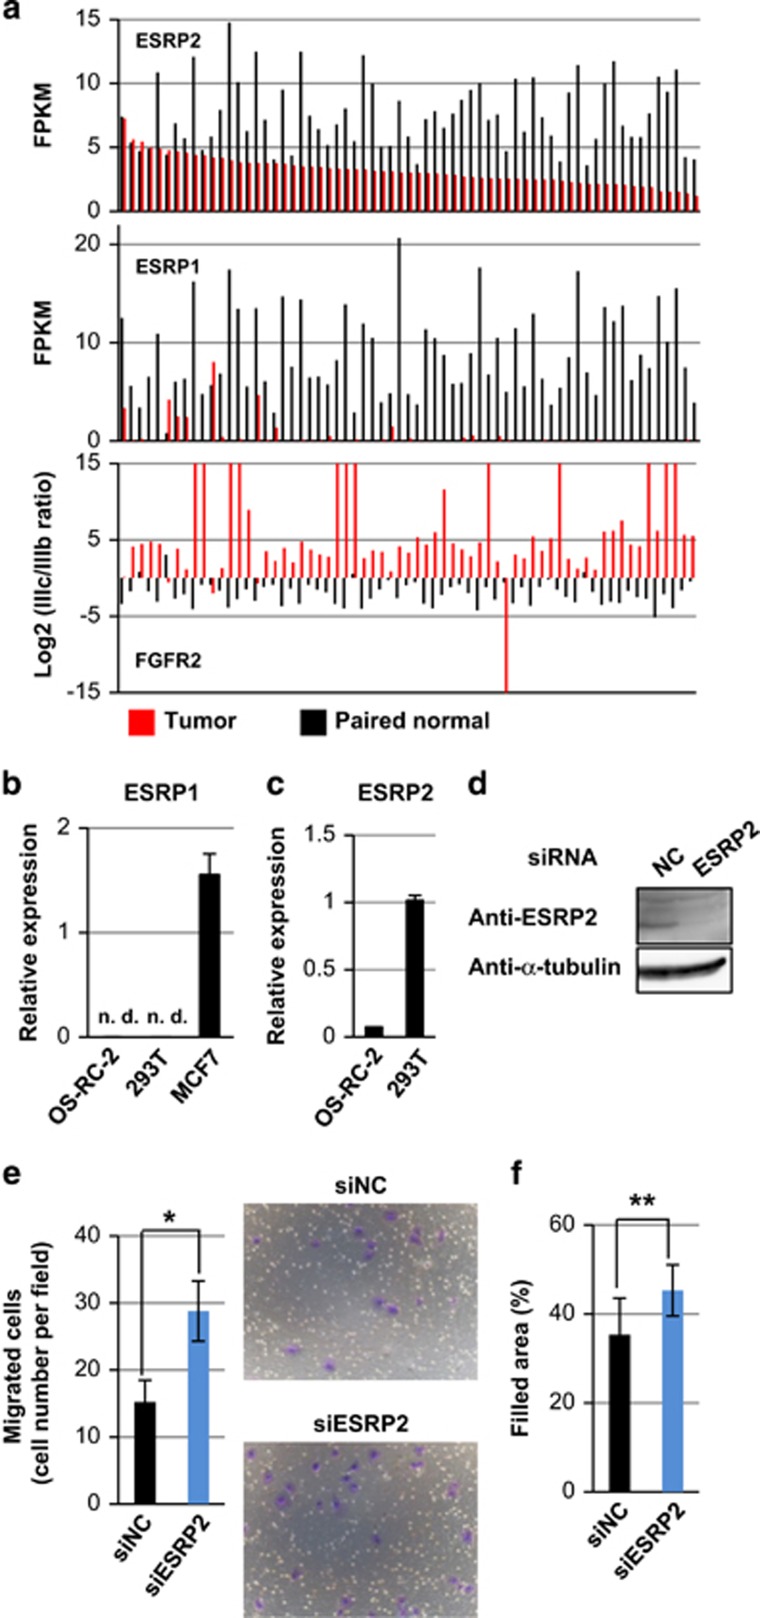
Expression of ESRPs in ccRCC. (a) Expression of ESRP2 (top) and ESRP1 (middle) in 65 tumor tissues and 65 paired normal tissues using the RNA-seq data from TCGA. The log 2 values of FGFR2 IIIc/IIIb ratios are shown in the bottom panel. FPKM: fragments per kilobase of exon per million mapped sequence reads. (b and c) qRT–PCR analysis of ESRP1 (b) and ESRP2 (c) expression in OS-RC-2 and HEK293T cells. MCF7 breast cancer cells were used as a positive control in (b). ND, not detected. (d) Immunoblot analysis to determine ESRP2 protein expression in HEK293T cells treated with ESRP2 siRNA. NC, negative control. (e and f) Transwell cell migration assay (e) and wound healing assay (f) in OS-RC-2 cells treated with siRNA for ESRP2. *P<0.01 and **P<0.05 by two-sided Student's paired t-test. Representative pictures are shown in (e). siNC: negative control siRNA.

