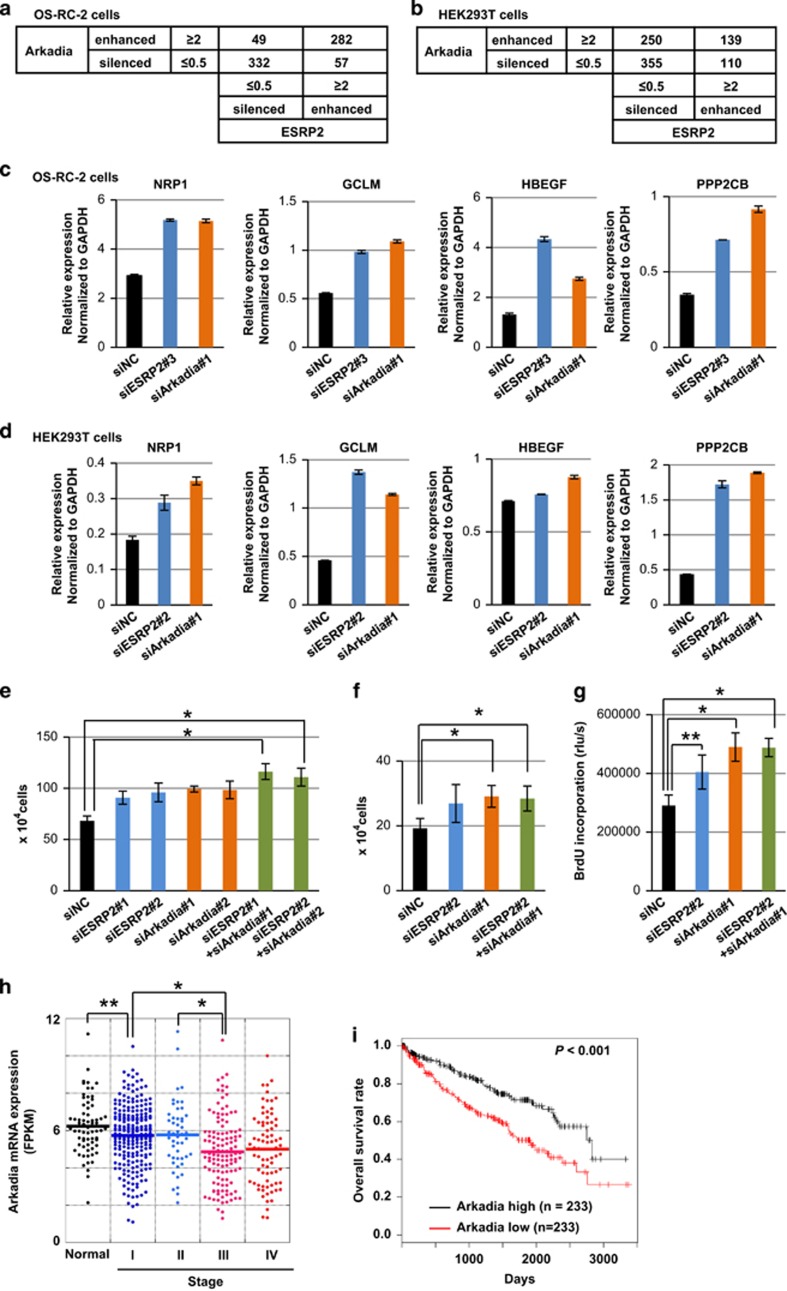
Figure 5.
Suppression of tumor growth by Arkadia. (a and b) Analysis using the 2x2 contingency matrix of RNA-seq data upon knockdown of Arkadia or ESRP2 in OS-RC-2 cells (a) and in HEK293T cells (b). We select the isoforms showing the maximum FPKM (fragments per kilobase of exon per million mapped sequence reads) values are z⩾5 among the three samples (siNC-treated, siESRP2-treated and siArkadia-treated) in OS-RC-2 or HEK293T cells. ESRP2-enhanced: siNC isoform/siESRP2 isoform is ⩾2. ESRP2-silenced, siNC isoform/siESRP2 isoform is ⩽0.5. Arkadia-enhanced and -silenced were determined using the same cutoff values as ESRP2-enhanced and -silenced, respectively. The number of appropriate isoforms for each category is described in the 2x2 contingency matrix. P<2.2E−16 by Fisher's exact test in (a). P<1.2E−04 by Fisher's exact test in (b). (c and d) qRT–PCR analyses of the expression of NRP1, GCLM, HBEGF and PPP2CB in OS-RC-2 cells (c) and in HEK293T cells (d) upon knockdown of ESRP2 or Arkadia. Values were normalized to GAPDH. Knockdown efficiency of Arkadia or ESRP2 is shown in Supplementary Figure S5. siNC, negative control siRNA; n=2. (e and f) Cell count assays using HEK293T (e) and OS-RC-2 (f) cells upon knockdown of ESRP2 and/or Arkadia. Cells were transfected with siRNA at the same time as seeding and counted after 48 h. Knockdown efficiency of Arkadia and ESRP2 is shown in Supplementary Figure S6. (g) BrdU assay using OS-RC-2 cells after knocking down ESRP2 and/or Arkadia. (h) Arkadia mRNA expression in 68 normal kidney tissues and 474 ccRCC tumors grouped into stages I–IV by TCGA clinical data. (i) Kaplan–Meier analysis of overall survival in ccRCC patients enrolled in the TCGA database, with classifications based on Arkadia mRNA expression in TCGA ccRCC RNA-seq data. Patients were divided into two equally sized groups based on Arkadia mRNA expression. The half of patients with higher Arkadia expression are shown in black, and the half of patients with lower expression are shown in red. In (e–h), *P<0.05 and **P<0.01 by two-sided Student's paired t-test. The P-value in (i) is based on the log-rank significance test.

