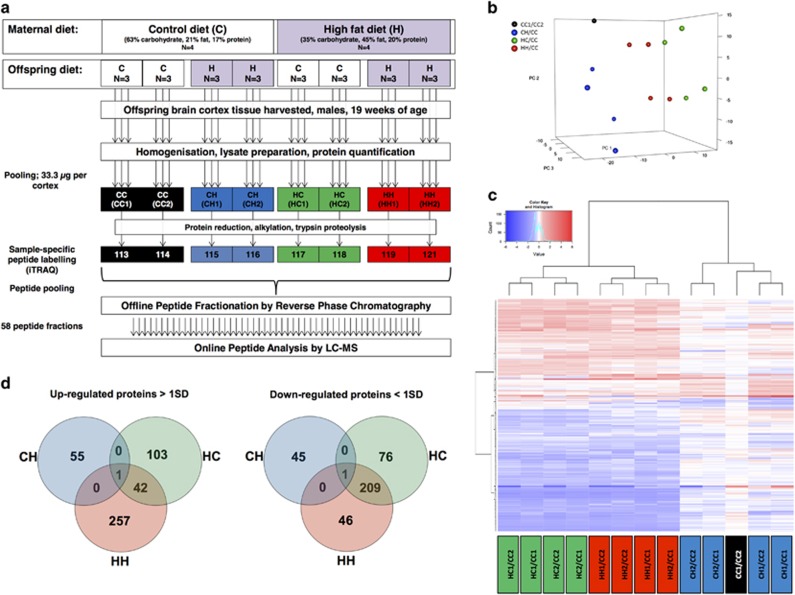
Figure 1.
(a) Proteomics workflow and labelling scheme, (b) Principal component analysis of the iTRAQ ratios of all analysed proteins in the cerebral cortex showing clustering of mice based on the maternal diet and not their current diet, that is, blue dots (CH/CC) clustering separately from red (HH/CC) and green dots (HC/CC) along principal component 1. The sample division along principal component 2 results from dividing each sample by a different control, that is, CC1 (dots in the top) or CC2 (dots in the bottom). (c) Venn diagrams of commonly up- and downregulated proteins in CH, HC and HH mice compared with controls (CC). (d) Hierarchical clustering analysis of modulated proteins: the HC and HH groups have a similar proteomic portrait, which was different from that of CH mice.

