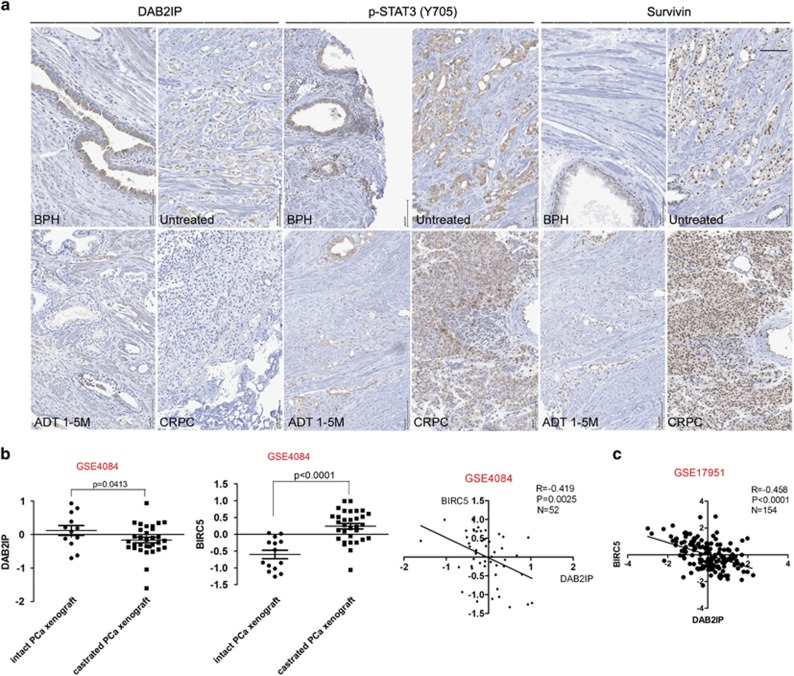
Figure 6.
Correlation of DAB2IP, p-STAT3 and survivin expression in clinical PCa or PDX tissues. (a) Representative IHC staining of DAB2IP, p-STAT3 (Y705) and survivin in clinical specimens (BPH, untreated, ADT 1-5 month (M) and CRPC) was shown. Scale bar=50 μm. (b) Microarray data set (GSE4084) with 52 human PCa xenografts was retrieved from the NCBI GEO and log2 data for individual probes was Z scored for plotting. Left and middle panel: relative expressions of DAB2IP and survivin (encoded by the BIRC5 gene) in intact or castrated mice were shown; right panel: Spearman's correlation coefficient of DAB2IP and survivin expression was shown. (c) Microarray data set (GSE17951) with 154 human PCa tissues was retrieved from the NCBI GEO and log2 data for individual probes was Z scored for plotting. Spearman's correlation coefficient between DAB2IP and survivin was shown

