Figure 1.
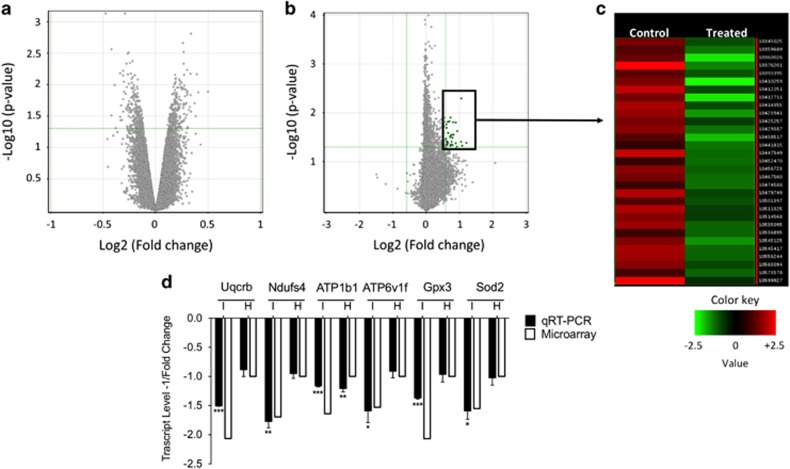
Differentially expressed genes between vehicle and 1x10⁻⁹ M BPA-treated samples for 48 h. Volcano plots of microarray data of hepatocytes (a) and islets (b). The y-axis value is the negative logarithm base 10 of the corrected P-value. A green horizontal line on the plot represents the user-defined significant threshold for P-value. The x-axis is shown as the logarithm base 2 of the fold change in expression level between treated and control. The green lines on the plot represents the user-defined significant threshold for P-value (horizontal) and fold change (vertical). Green dots are downregulated genes. (c) HeatMap showing the gene expression profile in the pancreatic islets microarray data. The expression value of each gene is mapped to a color-intensity value, as indicated by the color bar; (d) qRT-PCR validation of some inhibited genes in treated islets (I) and hepatocytes (H) compared with microarray data. Data are reported as the negative inverse of fold change value. The qRT-PCR results are expressed as the mean±SD of three independent experiments (N=3). *P-value <0.05; **P-value <0.01; ***P-value <0.001 compared with vehicle-only-treated cells

