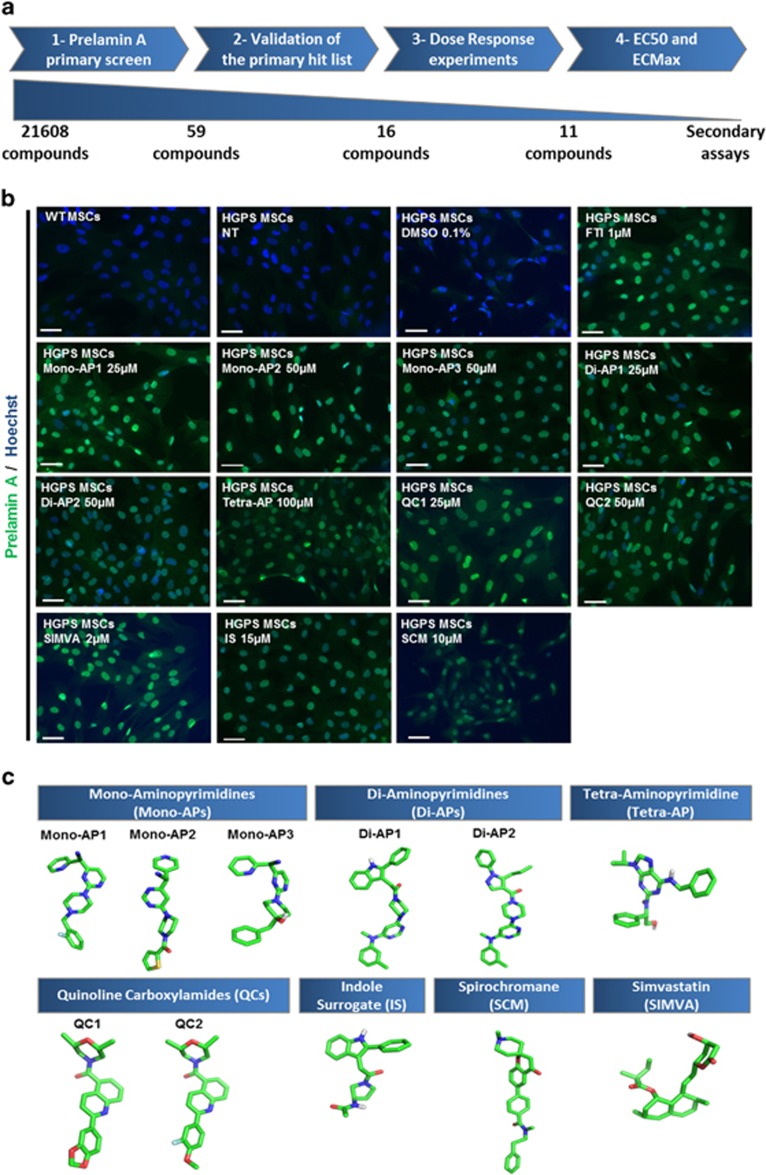
Figure 2.
Results of the screening of prelamin A modulators on HGPS MSCs. (a) Schematic representation of the four-step analysis leading to the identification of the hits list. (b) Prelamin A immunostaining of HGPS MSCs following 48 h of treatments with each of the 11 validated compounds. Scale bar represents 50 μm. (c) 3D chemical structures of considered molecules for secondary investigations. For clarity, only polar hydrogen atoms are represented

