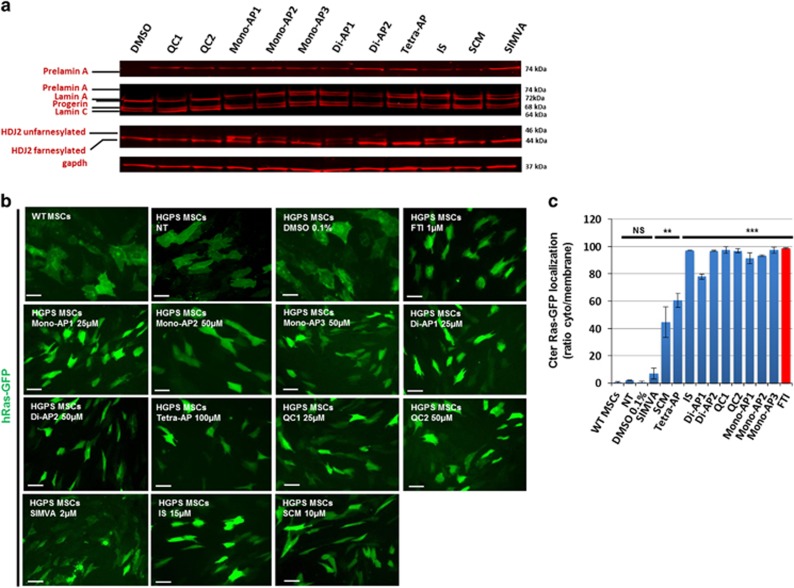
Figure 3.
Effect of the 11 validated compounds on farnesylation process. (a) Western blot analysis of Lamin A, lamin C, progerin, prelamin A and HDJ2 expression in HGPS MSCs following 48 h of treatment with each of the 11 validated compounds. (b) GFP localization of HGPS MSCs overexpressing hRas-GFP following 48 h of treatment with each of the 11 validated compounds. Scale bar represents 50 μm. (c) Quantification of the percentage of HGPS MSCs presenting a cytoplasmic (unfarnesylated) localization of GFP following 48 h of treatments with each of the 11 prelamin A modulators. Each chart represents the mean±S.D. of three independent experiments

