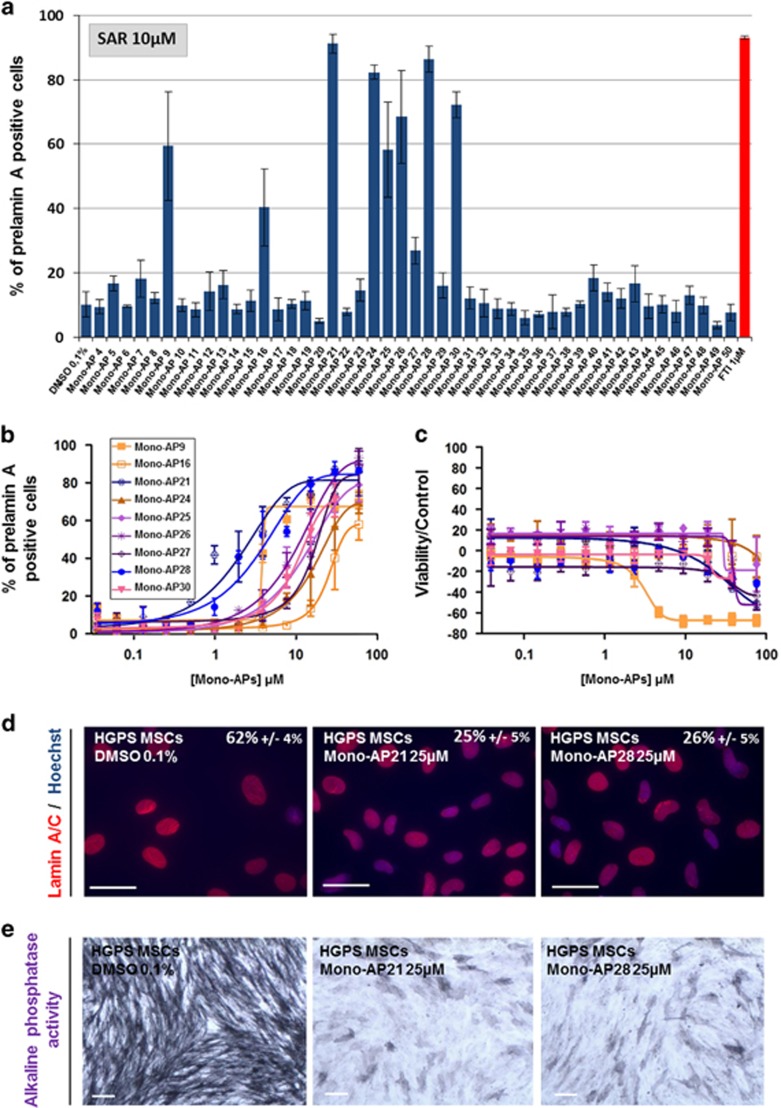
Figure 5.
Structure–activity relationship of Mono-APs. (a) Automated quantification of prelamin A-stained nuclei in HGPS MSCs following 48 h of treatment with 47 compounds containing a Mono-APs domain at 10 μM. Data are compared with FTI 1 μM (in red). Each value represents the mean±S.D. of the percentage of four replicates. (b) Dose-response analysis of the nine hits identified as positives (Mono-AP21, Mono-AP28, Mono-AP26, Mono-AP9, Mono-AP30, Mono-AP25, Mono-AP27, Mono-AP16, Mono-AP24) on prelamin A maturation process in HGPS MSCs. Each point represents the mean±S.D. of the percentage of eight replicates. (c) Cellular viability of HGPS MSCs after the treatment with the nine hits identified as positives (Mono-AP21, Mono-AP28, Mono-AP26, Mono-AP9, Mono-AP30, Mono-AP25, Mono-AP27, Mono-AP16, Mono-AP24). Each point represents the mean±S.D. of the percentage of eight replicates. (d) Measure of nuclear shape abnormalities (lamin A/C immunostaining) in HGPS MSCs following 48 h of treatment with Mono-AP21 25 μM and Mono-AP28 25 μM. Values represent the mean±S.D. of three independent experiments. (e) Alkaline phosphatase activity of HGPS MSCs following 7 days of differentiation in the presence of Mono-AP21 25 μM and Mono-AP28 25 μM

