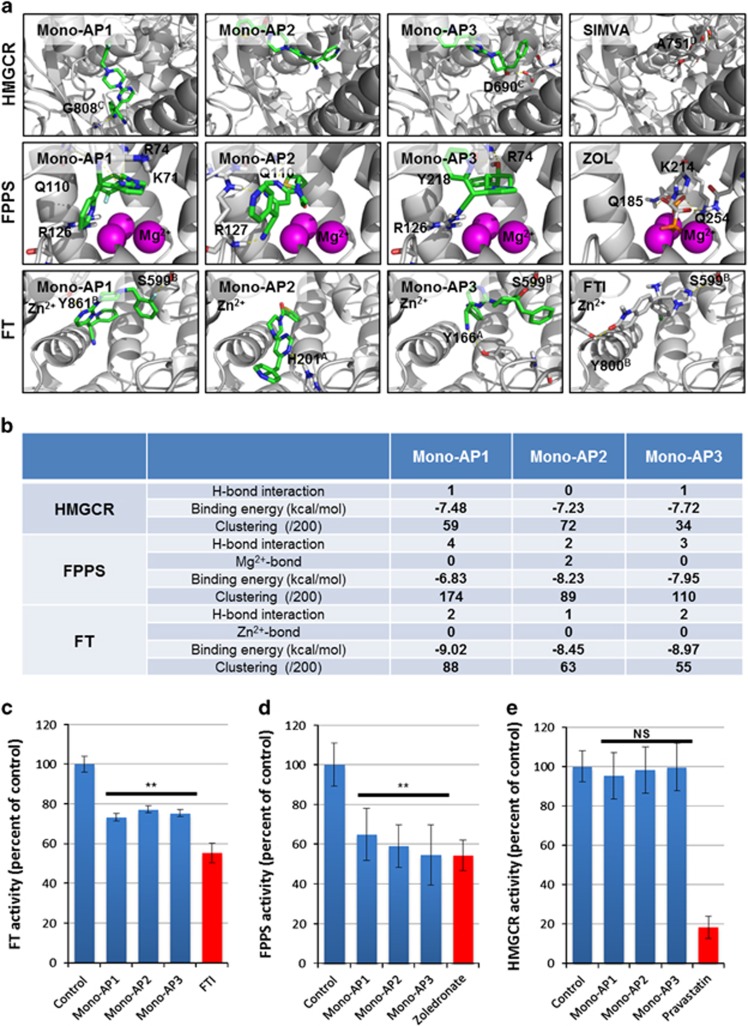
Figure 6.
Molecular docking of Mono-APs on HMG-CoA reductase (HMGCR), farnesyl pyrophosphate synthase (FPPS) and farnesyl transferase (FT). (a) Molecular docking representation of complexes between HMGCR (up), FPPS (middle) and FT (down) enzymes and compounds belonging to the Mono-AP family (Mono-AP1, Mono-AP2 and Mono-AP3) and their respective positive control molecules simvastatin (SIMVA), zoledronate (ZOL) and the tipifarnib (FTI). Enzymes are represented in white ribbons and interacting amino acids are in white thin sticks. Mono-APs are illustrated in green sticks and positive control molecules are in gray sticks. Cations Mg2+ and Zn2+ are represented in sphere and colored in magenta and black, respectively. (b)Table of molecular docking results with Mono-APs molecules showing the number of hydrogen bonds, interactions with cations, calculated binding energies (kcal/mol), and clustering. (c) Measure of FT activity in presence of Mono-AP1 25 μM, Mono-AP2 50 μM and Mono-AP3 50 μM. Tipifarnib 1 μM (FTI) was used as positive control. Results are presented in percent of control. Each point represents the mean±S.D. of the percentage of 8 replicates. (d) Measure of FPPS activity in presence of Mono-AP1 25 μM, Mono-AP2 50 μM and Mono-AP3 50 μM. Zoledronate 1 μM was used as positive control. Results are presented in percent of control. Each point represents the mean±S.D. of the percentage of 8 replicates. (e) Measure of HMGCR activity in presence of Mono-AP1 25 μM, Mono-AP2 50 μM and Mono-AP3 50 μM. Pravastatin 1 μM was used as positive control. Results are presented in percent of control. Each point represents the mean±S.D. of the percentage of eight replicates

