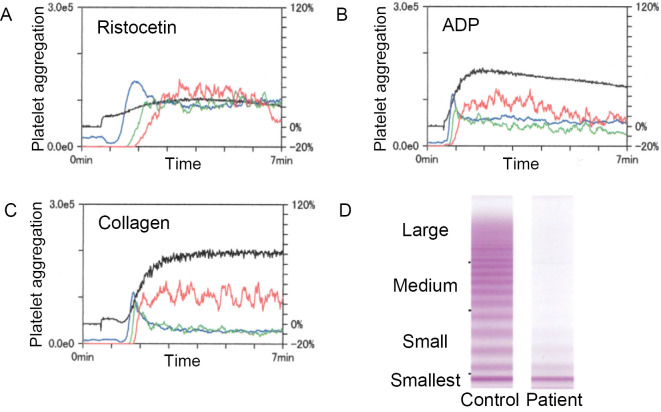
Figure 3.
Coagulopathy due to AVWS. (A) - (C) Decreased ristocetin-induced platelet aggregation. Platelet aggregation curves induced by (A) ristocetin, (B) ADP, and (C) collagen are shown. The blue, green, and red lines show platelet aggregation of small, medium, and large size, respectively (left axis). The black line shows the total aggregation (right axis). The aggregation was positive when the total coagulation was higher than 50%. (D) von Willebrand factor multimer assay. The absence of large- and medium-sized multimers is shown.

