Figure 3.
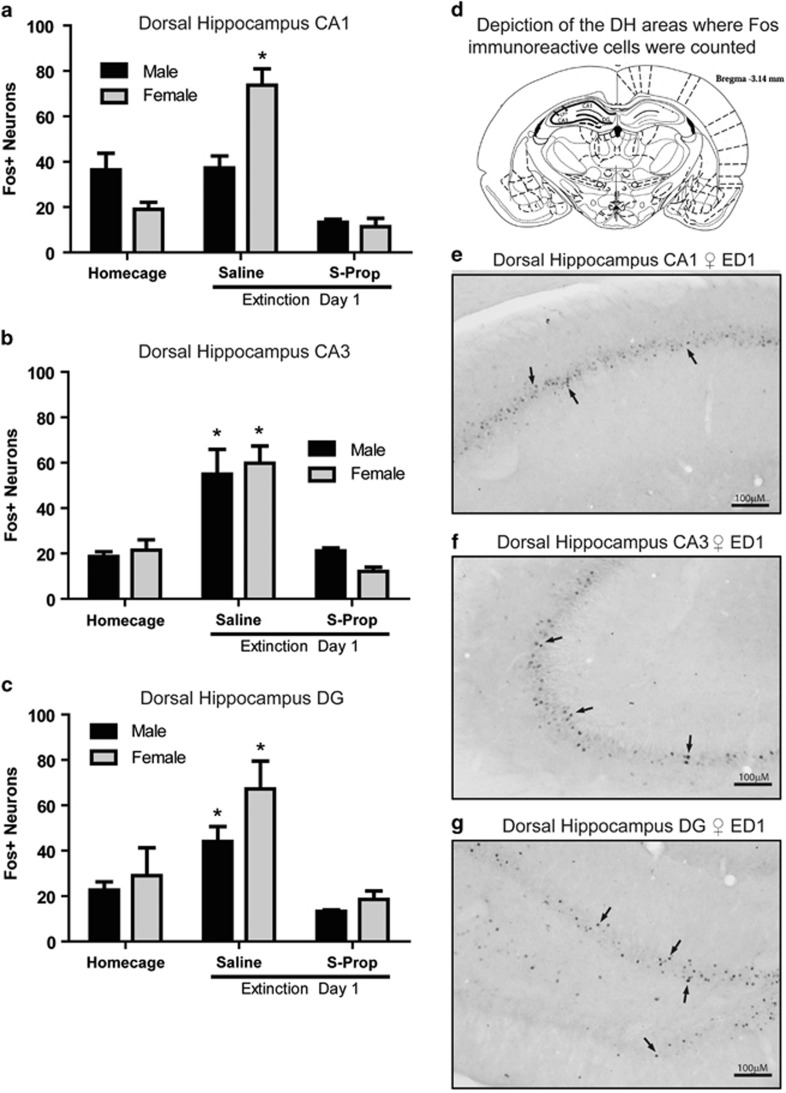
Fos expression in dorsal hippocampus is increased in females on ED1 compared with homecage controls. Hippocampus Fos+ neurons were measured in CA1, CA3, and dentate gyrus (DG) in male and female rats following homecage or ED1 exposure (n=4–8/group). ED1 rats were administered saline or S-propranolol (10 mg/kg, i.p.) 30 min before ED1 testing, and perfused 30 min following the 90 min ED1 test. Homecage controls were euthanized directly from the homecage at the same time of day as ED1 rats. Statistics for all panels are provided in Supplementary Table S2. Two-way ANOVAs were performed between sex and condition followed by post hoc t-tests for all analyses. (a) Numbers of Fos+ neurons in CA1 of male and female homecage, ED1 saline, or ED1 S-propranolol (Ed1 S-prop) rats (n=4–10/group). There was a significant interaction between sex and test condition on Fos+ neurons in CA1. The post hoc tests revealed that in females, ED1 increased Fos+ neuron expression compared with homecage controls, and S-prop reduced Fos+ neuron expression to that of homecage levels; *p<0.001. (b) Numbers of Fos+ neurons in CA3 of male and female homecage, ED1 saline, or ED1 S-prop rats (n=4–9/group). There was a significant main effect of test condition on Fos+ neurons in CA3. The post hoc tests revealed that ED1+saline male or female rats had increased Fos compared with respective homecage or ED1+S-prop rats; *p<0.001. (c) Numbers of Fos+ neurons in DG of male and female homecage, ED1 saline, or ED1 S-prop rats (n=4–9/group). There was a significant main effect of test condition on Fos+ neurons in DG. The post hoc tests revealed male and female rats had significantly higher Fos compared with homecage or S-prop rats; *p<0.001. (d) Depiction of DH areas where Fos was counted, representative image from Bregma −3.14 (Paxinos and Watson, 2006). (e) Representative image of Fos expression in DH CA1 from an ED1+Saline female. Scale bar=100 μM. (f) Representative image of Fos expression in DH CA3 from an ED1+Saline female. Scale bar=100 μM. (g) Representative image of Fos expression in DH DG from an ED1+Saline female. Scale bar=100 μM.

