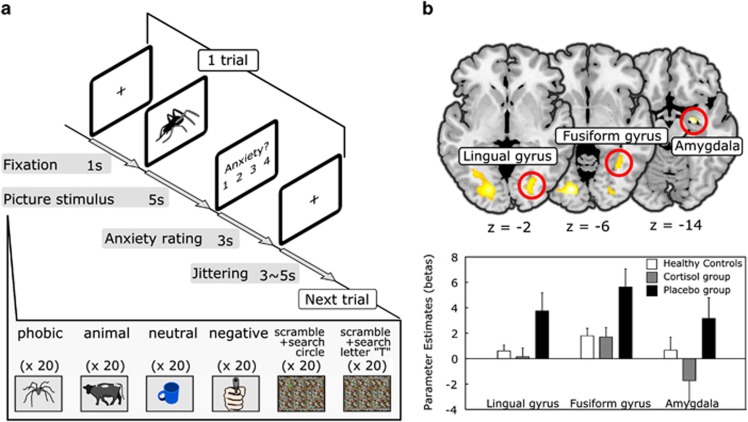
Figure 1.
The cognitive task and regional activation during spider picture presentation. (a) The timeline of the picture task is shown. Each trial includes the picture presentation and rating periods. (b) Top: the brain areas that showed higher levels of activation during the spider picture presentation in the placebo group compared with the cortisol group are shown, as derived from a 3 (group) × 6 (condition) factorial ANOVA. For these representative images, all the voxels survived at p<0.001 uncorrected are depicted. Bottom: a plot of the parameter estimates for phobia-related picture presentation in the right lingual gyrus, right fusiform gyrus, and right amygdala is shown. The error bars indicate SE across subjects. The bar plots are representative images and were not the basis of any inferences in this study.

