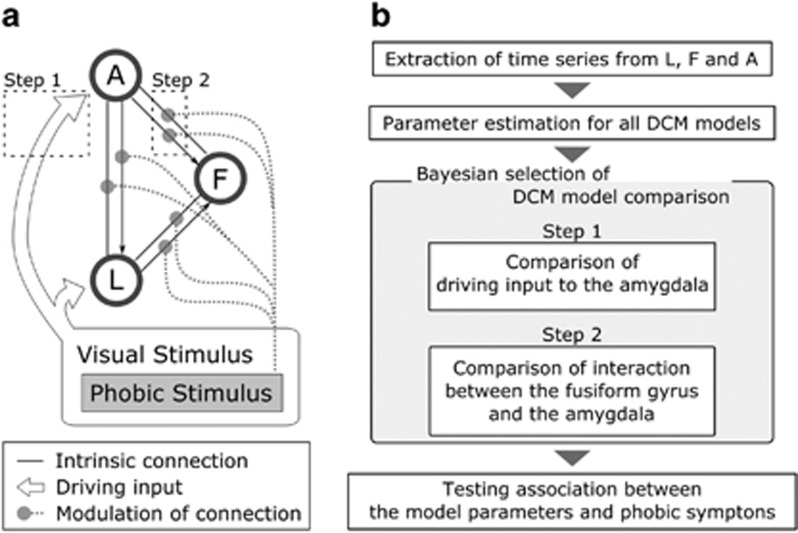
Figure 2.
DCM model structure and the two steps approach of DCM model comparison. (a) The structure of the networks used for DCM analysis are shown. L, F, and A were supposed to have intrinsic connections to each other, although the driving inputs and modulation of the connections by the phobia-related stimulus (spider picture) differed between models. To test the effect of cortisol on this neural network, Bayesian model selection was applied for a family-level model comparison. Two different features were determined separately and were illustrated as dashed squares (step 1 and step 2). (b) An overview of the DCM analysis and Bayesian model selection is shown. At step 1, all the models were compared according to the pattern of the driving input into the amygdala. At step 2, the models for the winning family in step 1 were compared according to the pattern of interaction between the fusiform gyrus and the amygdala.

