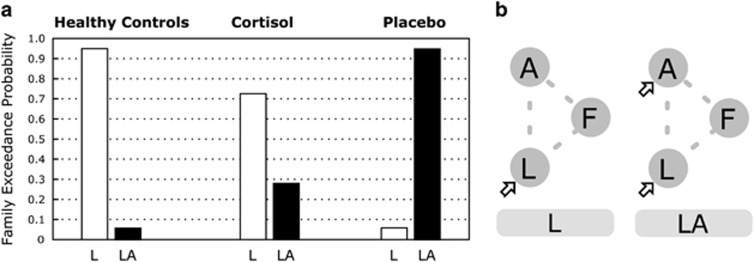
Figure 3.
The first step of the model comparison of driving inputs. (a) The exceedance probabilities of the L and LA model families are shown. Family L has visual inputs only into the lingual gyrus, whereas family LA has inputs into both the lingual gyrus and the amygdala. The group of patients treated with placebo (right) showed a considerably higher exceedance probability of the LA model family than that of the L model family. By contrast, the cortisol group (center) and the healthy control group (left) showed considerably higher exceedance probability of the L model family than that of the LA model family. (b) The diagrams of the family L and family LA show the structures of the driving inputs (empty arrow). The modulation of the connection and intrinsic connection are not shown for comprehensibility. Three regions included in the DCM models are denoted by L (lingual gyrus), F (fusiform gyrus), and A (amygdala).

