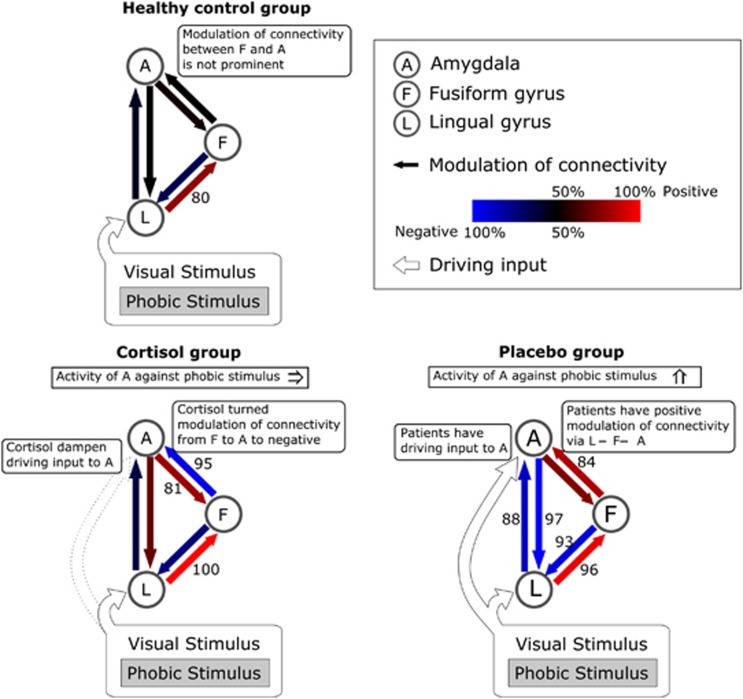
Figure 5.
Graphic summary of posterior probability of Bayesian model averaging. Blue and red arrows represent the negative and positive modulation of connection, respectively. The color saturation of the arrows represents the strength/posterior probability of connectivity. The numbers indicate the posterior probability of each modulatory connectivity (only posterior probability >80% is shown).

