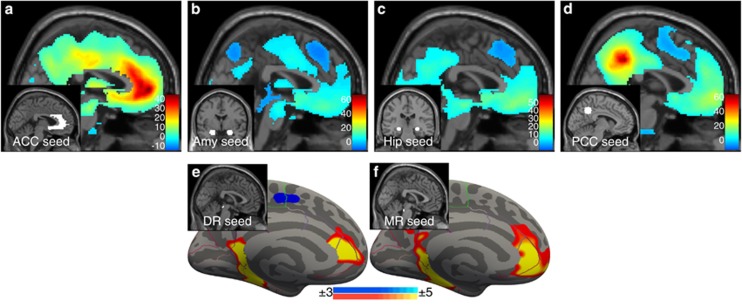
Figure 1.
Resting-state functional connectivity maps across participants at baseline. (a–d) Statistical parametric maps showing areas significantly correlated with (a) anterior cingulate cortex, (b) amygdala, (c), hippocampus, (d) posterior cingulate cortex. Color bars represent t-scores. Sagittal slice is X=0. (e and f) Surface maps showing medial wall areas significantly correlated with (e) dorsal raphe and (f) median raphe seeds as reported previously (Beliveau et al, 2015). Color bars represent negative log10 p-values. Warm colors denote a positive correlation whereas cool colors denote a negative correlation. Outline of respective seed inset.

