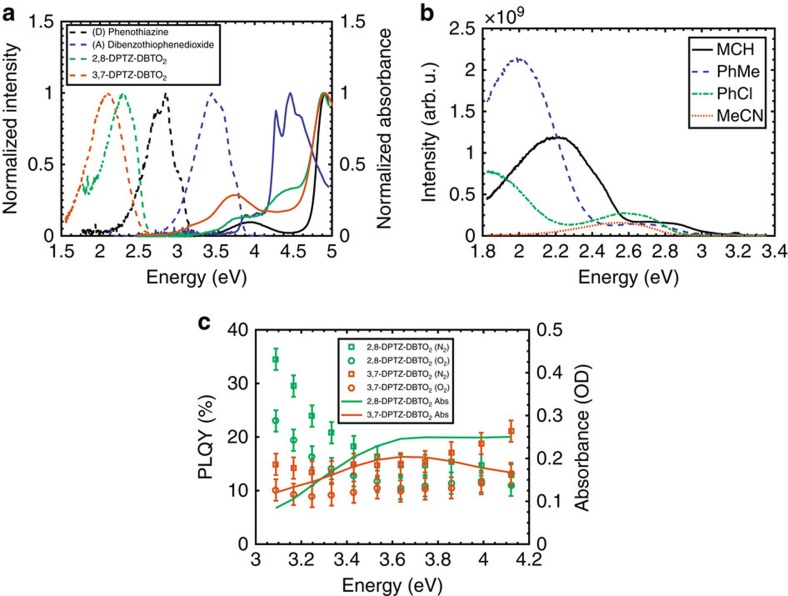
Figure 2. Optical properties of the isomers and subunits and solvatochromism of 3,7-DPTZ-DBTO2.
(a) The absorption (solid lines) and emission spectra (dashed lines) of 2,8-DPTZ-DBTO2, 3,7-DPTZ-DBTO2 and the subunits in MCH. (b) Solvatochromism of the quasi-axial and quasi-equatorial CT states emission in 3,7-DPTZ-DBTO2. The quasi-equatorial CT shifts strongly as a function of solvent polarity from ∼2.54 eV to below 2.25 eV, however the higher energy quasi-axial CT state displays a much weaker bathochromic shift from 3.1 to 2.9 eV. N.B. The onset for the quasi-equatorial CT appears to be above 2.6 eV in MCH; however, this is the influence of the quasi-axial CT broadening the quasi-equatorial CT spectrum. The method for estimating the CT onsets can be found in the Supplementary Figs 2–6 of our recent work7. An example of how this method was used for Fig. 2b is shown in Supplementary Fig. 21, with extracted values in Supplementary Table 15. (c) The PLQY of the two isomers with and without oxygen in a zeonex host. The PLQY is shown as a function of excitation energy and the absorption is included to show the wavelength dependency. The error bars are the s.e. based on 10 repetitions for each excitation energy.

