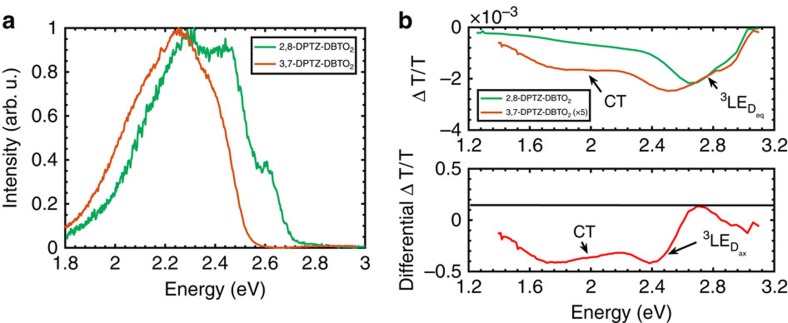
Figure 6. Phosphorescence emission and the out of phase and differential PIA of the DPTZ-DBTO2 isomers.
(a) The phosphorescence spectra are measured at 80 K in a zeonex matrix at 0.5 ms delay time. (b) The peak that is located below 2.4 eV in both spectra is attributed to the T1–TN absorption of phenothiazine. The broad absorption up to 1.4 eV found in 3,7-DPTZ-DBTO2 is attributed to the CT states emphasizing the energy diagram shown in Fig. 1c. The normalized differential is shown to emphasize the CT state PIA and the shift in the 3LE PIA.

