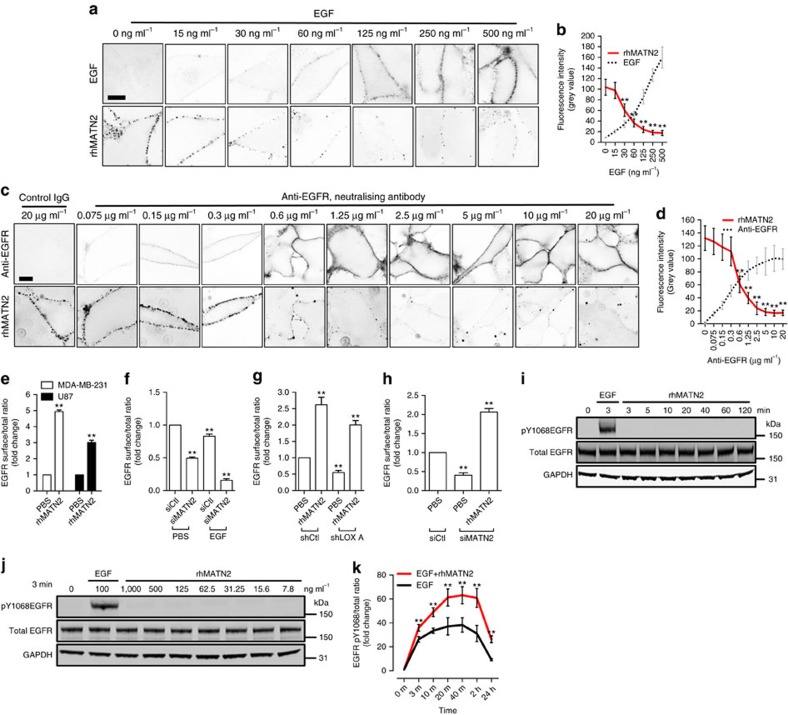
Figure 4. MATN2 traps EGFR at the cell surface.
(a) Confocal photomicrographs (inverted images) of rhMATN2 (500 ng ml−1) binding to PBS or EGF-treated MDA-MB-231 cells at 4 °C at the indicated EGF concentrations. Scale bar, 10 μm. (b) Quantification of the fluorescence intensity from images in a. (c) Confocal photomicrographs (inverted images) of rhMATN2 (500 ng ml−1) binding to control IgG or anti-EGFR-treated MDA-MB-231 cells at the indicated anti-EGFR antibody concentrations. Scale bar, 10 μm. (d) Quantification of the fluorescence intensity from images in c. All data in b,d are represented as mean±s.d. from 50 images for each data point. **P<0.01, Student's t-test. (e) Surface EGFR level in PBS or rhMATN2 treated (500 ng ml−1) MDA-MB-231 and U87 cells. (f) Surface EGFR level in PBS or EGF-treated control (siCtl) and MATN2-depleted (siMATN2) MDA-MB-231 cells. (g) Surface EGFR level in PBS or rhMATN2 treated control (shCtl) and LOX-depleted (shLOX A) MDA-MB-231 cells. (h) Surface EGFR level in PBS or rhMATN2-treated control (siCtl) and MATN2-depleted (siMATN2) MDA-MB-231 cells. (i) Western blots showing pY1068EGFR, total EGFR and GAPDH in EGF stimulated (100 ng ml−1, 3 min, positive control) or rhMATN2 stimulated (500 ng ml−1, indicated time points) MDA-MB-231 cells. (j) Western blots showing pY1068EGFR, total EGFR and GAPDH in MDA-MB-231 cells stimulated with increasing concentrations of rhMATN2 for 3 min. 100 ng ml−1 EGF was used as positive control. (k) EGFR activation in MDA-MB-231 cells treated with EGF, or EGF and rhMATN2 at indicated time points. All data in e–h and k are represented as mean±s.d. from three independent experiments. **P<0.01, Student's t-test.

