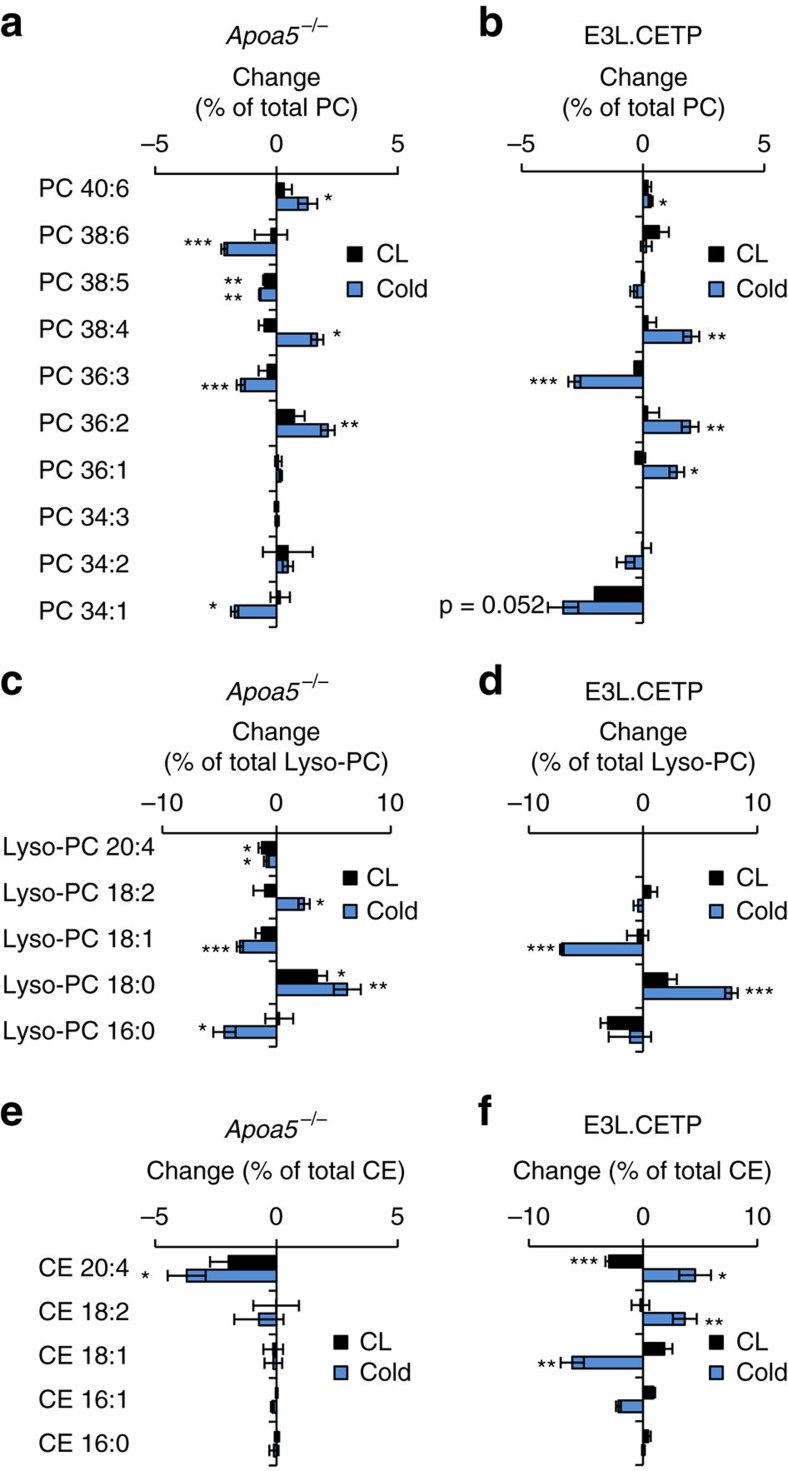
Figure 3. Thermogenic activation causes characteristic HDL lipidome remodelling.
Lipidomic analysis of HDL from (a,c,e) Apoa5−/− and (b,d,f) E3L.CETP mice after 7 days of CL or cold treatment. Changes in (a,b) PC, (c,d) Lyso-PC, (e,f) CE species relative to mock-treated mice, determined by high-resolution mass spectrometry, are represented as per cent weight changes relative to the whole-lipid class. For example, a 5% change in a PC species translates to, for example, 20% abundance of this lipid to 25% of total PC. Calculated values are mean±s.e.m. (n=4-5 per group). Post hoc correction for multiple testing was performed using the Benjamini–Hochberg method for the number of lipids shown. *P<0.05, **P<0.01, ***P<0.001, versus mock (Student's t-test).

