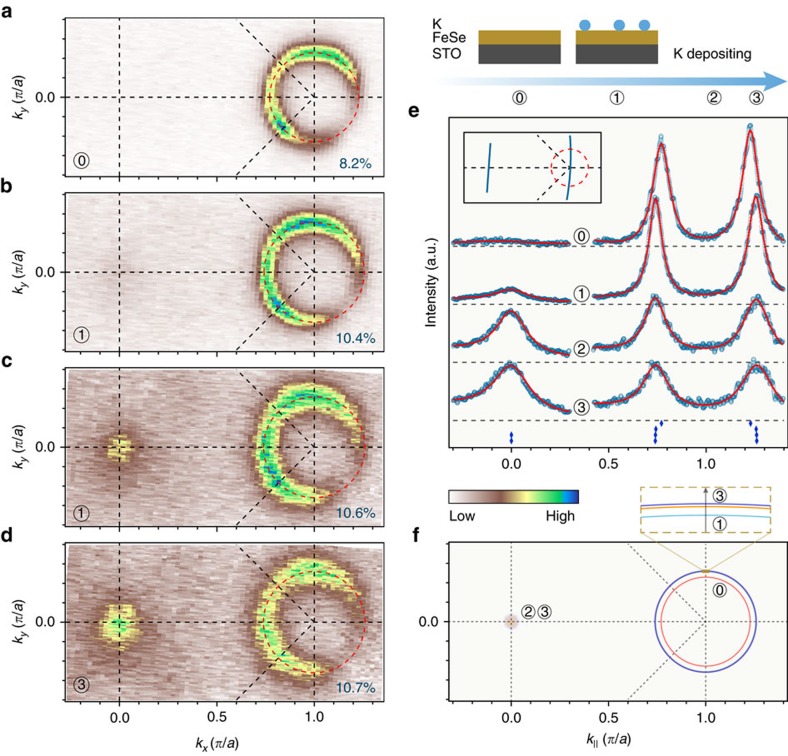
Figure 1. FS evolution of potassium-coated 1UC FeSe/STO.
(a) FS intensity map of a pristine sample recorded at 20 K and integrated within a 20 meV energy window with respect to EF. The doubly degenerate electron pocket occupies an area of ∼8.2% of the whole BZ, thus giving an electron carrier concentration of 0.164 electrons per unit cell according to the Luttinger theorem. (b–d) Same as a but for the film after potassium was coated continuously. The percentages at the right bottom of each panel indicate the areas of the electron FS around M in the 1-Fe BZ. The size of the electron pocket at M is saturating slowly upon successive rounds of potassium deposition (∼10.4%, ∼10.6% and ∼10.7% for the first, second and third rounds of deposition, respectively), but instead the spectrum gets broadened, due to the induced disorder at the surface. (e) Evolution of the momentum distribution curves along the high-symmetry cuts indicated in the inset upon potassium coating. The red curves correspond to fits of the data using multiple Lorentz functions. (f) Comparison of the FSs shown in a–d.

