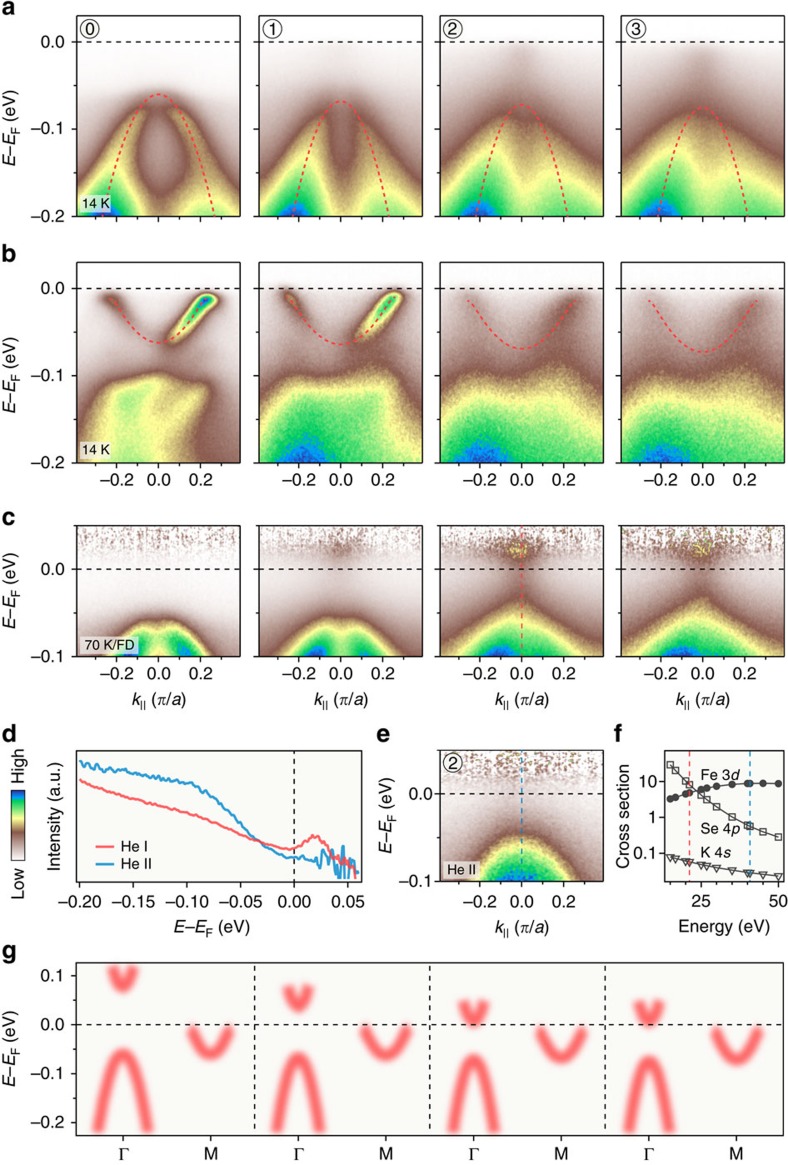
Figure 2. Electronic band structure.
(a,b) Potassium coating evolution of the ARPES intensity plots at 14 K near Γ and M along the direction shown in the inset of Fig. 1e. The dashed red curves are parabolic fits to the band dispersions. (c) Intensity plots along the same cut as in a, but recorded at 70 K. The plots are divided by the Fermi–Dirac distribution function convoluted by the resolution function to visualize the states above EF. (e) Intensity plot near Γ recorded with He II rather than He Iα photons for the potassium coated sample labelled as 2. (d) Comparison of the EDCs at Γ recorded with He Iα and He II beams. (f) Calculated atomic photonionization cross sections for Fe 3d, Se 4p and K 4s. (g) Comparison of the band dispersions along the Γ–M high-symmetry line. The energy positions of the electron-like band around Γ are taken from the reference or estimated from the data in c.

