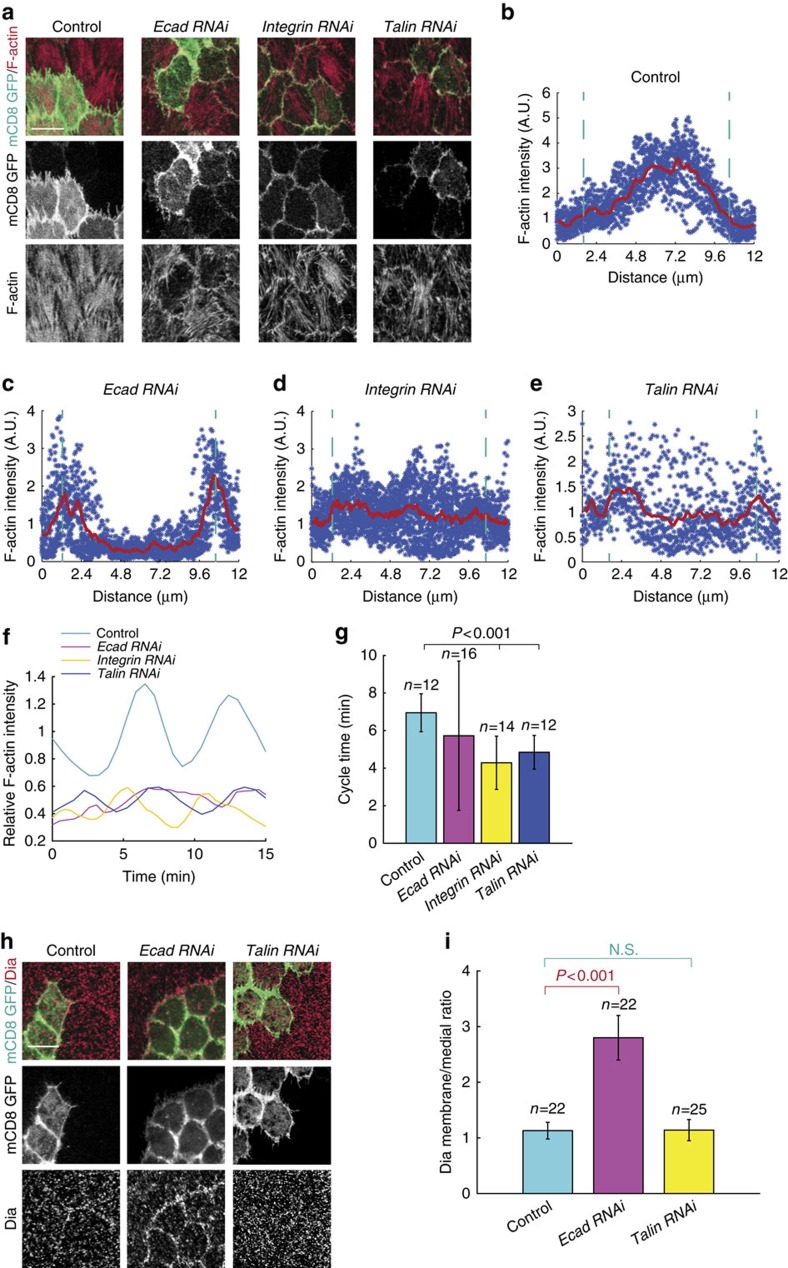
Figure 5. Cell–cell adhesion controls the distribution pattern of basal F-actin and Dia.
(a) Confocal micrographs of F-actin signal in follicle cell clones expressing the indicated transgenes, marked by coexpression of mCD8GFP. F-actin signals have been assessed by phalloidin staining. (b–e) Individual mean fluorescent intensities and total averages of basal F-actin signal from linescans across the indicated follicle cells (18<n<30) in a. Dotted green lines label the anterior and posterior cell junctional membranes. Each blue dot is an individual intensity and red graph is the average value. (f) Quantification of the dynamic changes of F-actin intensity in one representative oscillating cell with the indicated genetic backgrounds. F-actin dynamics have been assessed by UtrABD-GFP. Average intensity of F-actin signal in the control oscillating cell is set as 1. (g) Quantification of average F-actin oscillating cycle time period in the indicated genetic backgrounds. (h) Confocal micrographs of Dia signal in follicle cell clones expressing the indicated transgenes, marked by coexpression of mCD8GFP. Both scale bars are 10 μm. (i) Quantification of the membrane to medial Dia intensity ratio in follicle cell clones with the indicated genetic backgrounds. n is the number of samples analysed. Error bars indicate ±s.d. N.S. means no significant difference, while P<0.001 means significant difference by student's t-test.

