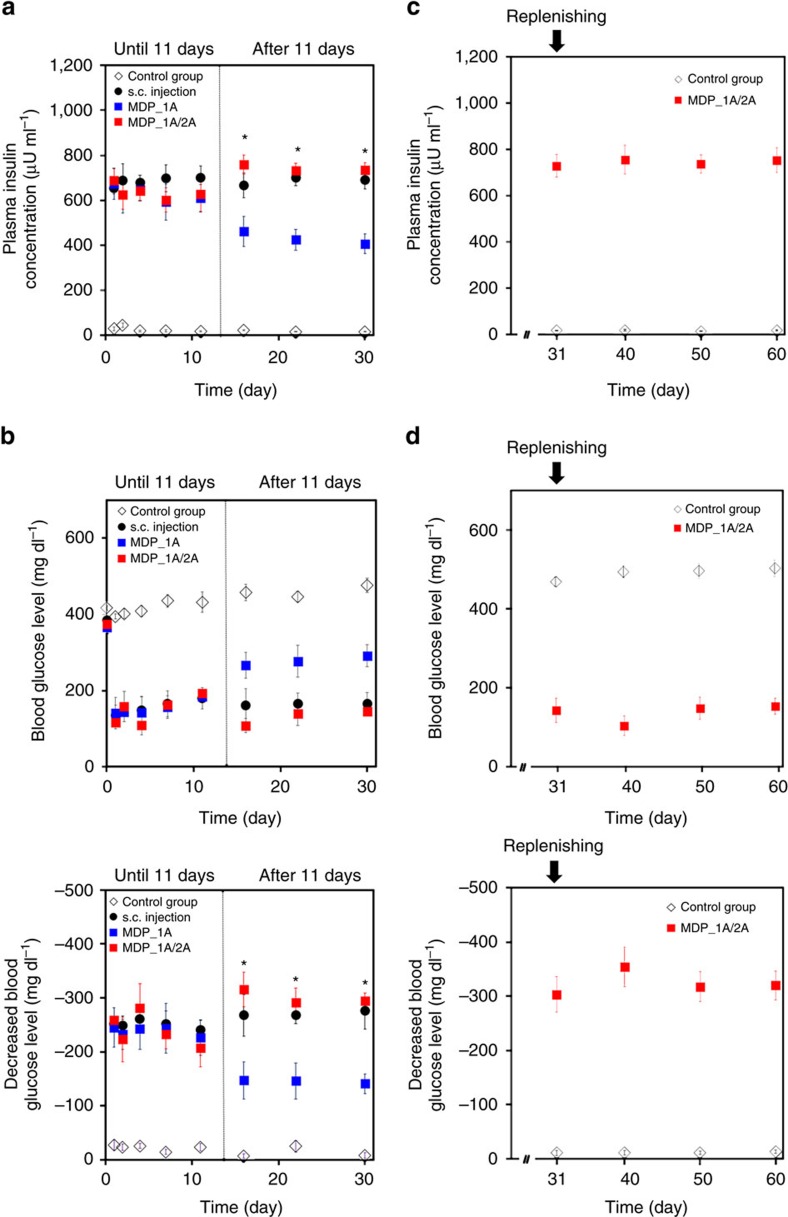
Figure 3. In vivo profiles of insulin delivery.
The profiles of (a,c) plasma insulin concentration and (b,d) blood glucose level were obtained from the four different animal groups: (i) control group-diabetic rats with no treatment (n=4), (ii) s.c. injection group-diabetic rats subcutaneously injected with an insulin solution (0.8 U insulin) with a Hamilton microlitre syringe at each of the scheduled times (n=4), (iii) MDP_1A group-diabetic rats implanted with the MDP in the subcutaneous space and treated with a single actuation (0.8 U insulin) at each of the scheduled times (n=4); and (iv) MDP_1A/2A group-diabetic rats implanted with the MDP and treated with a single actuation (0.8 U insulin) at each of the scheduled times until 11 days and two consecutive actuations (1.6 U insulin) at each of the scheduled times after 11 days (n=4). For each actuation, the external device with ME was applied and removed to the skin immediately above the implanted MDP. After insulin was delivered via actuation or injection, blood was withdrawn at Tmax, insulin=60 min to measure the maximum insulin concentration and also at Tmax, glucose=120 min to measure the minimum glucose level and its maximum decrease (Supplementary Fig. 11). Error bars are s.d. (a,b) The plasma was sampled at scheduled times of 1, 2, 4, 7, 11, 16, 22 and 30 days with the four different animal groups. (c,d) After 30 days, we continued the experiment with the two different animals groups: (i) control and (iv) MDP_1A/2A groups. At 31 days, for the MDP_1A/2A group, we fully withdrew the insulin solution in the drug reservoir and refilled it with 1.2 ml of a fresh one while the MDP was still implanted (Supplementary Fig. 6). The plasma was sampled at scheduled times of 31, 40, 50 and 60 days. *, the MDP_1A group was statistically significantly different from the MDP_1A/2A group (P<0.05).

