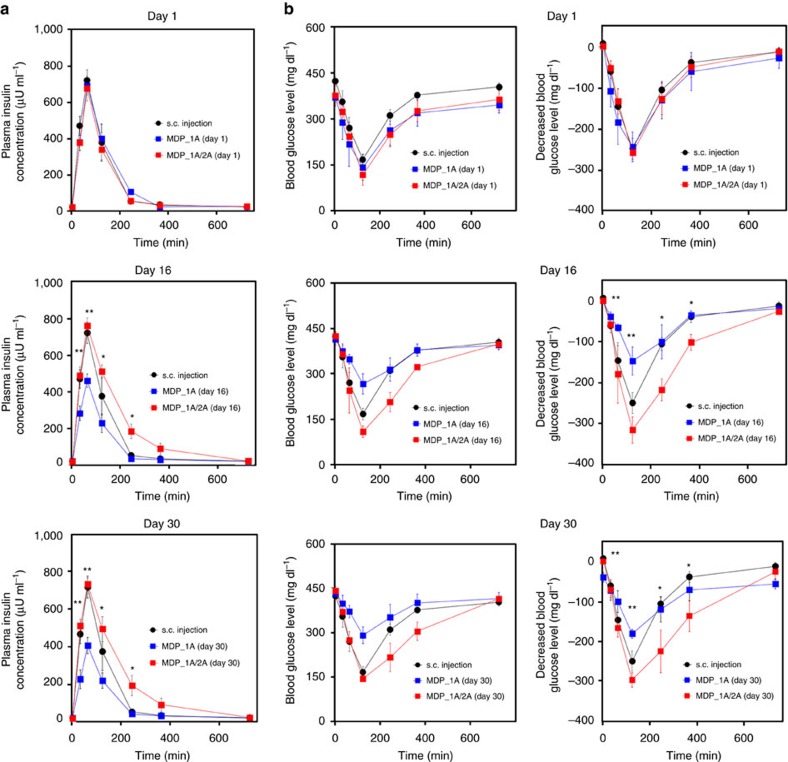
Figure 4. In vivo short-time profiles of insulin delivery.
The profiles of (a) plasma insulin concentration and (b) blood glucose level were obtained at shorter time scales at -1 to 720 min on days 0, 16 and 30 from the four different animal groups: (i) control group (n=4), (ii) s.c. injection group (n=4), (iii) MDP_1A group (n=4) and (iv) MDP_1A/2A group (n=4). Error bars are s.d. **, the MDP_1A group was significantly different from both the s.c. injection and MDP_1A/2A groups (P<0.05). *, the MDP_1A group was statistically significantly different from the MDP_1A/2A group (P<0.05).

