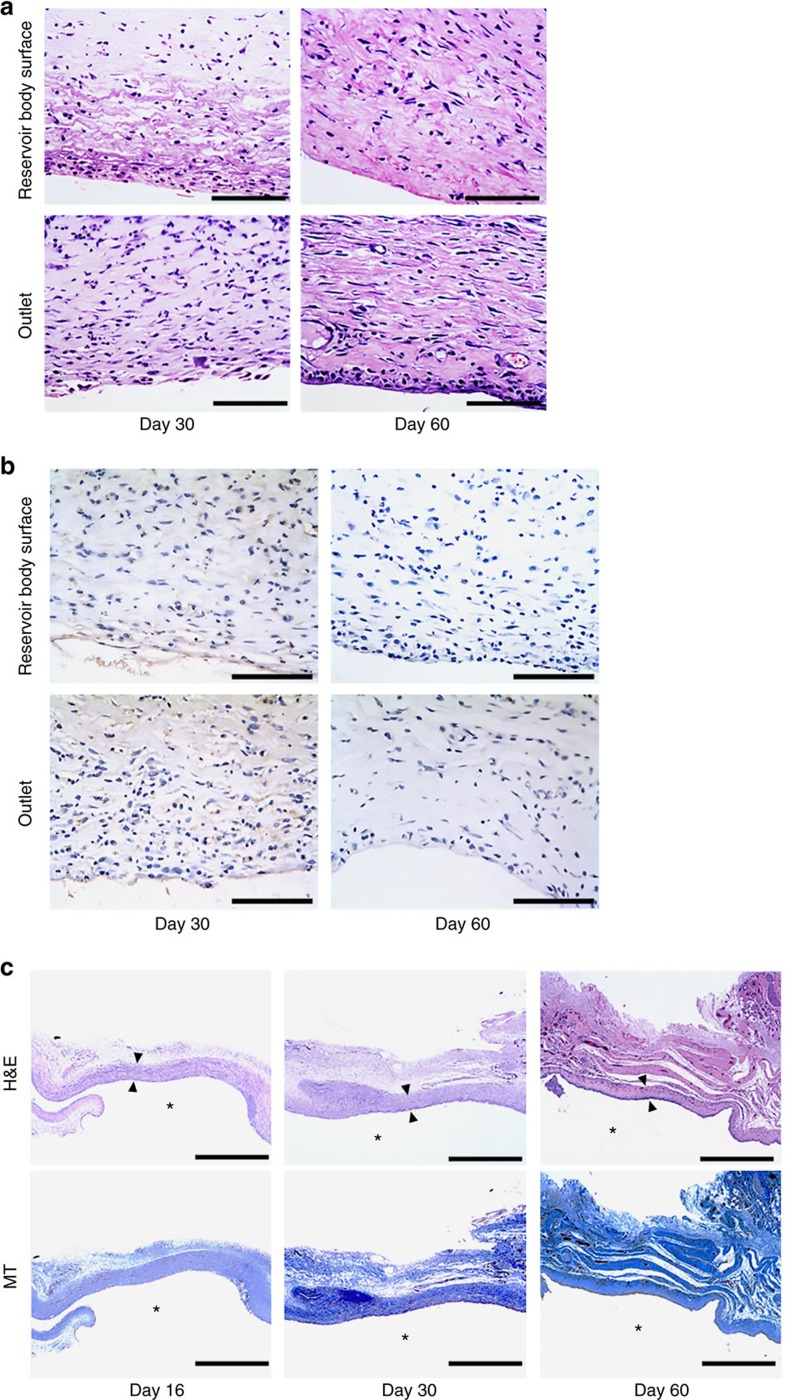
Figure 5. Representative histological images of the tissues around the MDP.
Two distinct locations in the tissue were observed: the tissues near the reservoir body surface and near the outlet of the MDP. The asterisk (*) indicates the location of the implanted MDP. n=4; 16 days, n=5; 30 days and n=4; 60 days. To evaluate biocompatibility, we assessed the degree of inflammatory response in (a) hematoxylin and eosin (H&E)-stained and (b) CD68-stained tissues near both the reservoir body surface and the outlet of the MDP at 30 and 60 days after implantation. Scale bar, 100 μm. (c) Formation of collagen was assessed in both H&E- and Masson's trichrome (MT)-stained tissues near the outlet of the MDP at 16, 30 and 60 days after implantation. To measure the capsule thickness, the thinnest region of the capsule was selected in each image of the H&E-stained samples, as indicated by the arrows. Scale bar, 1 mm.

