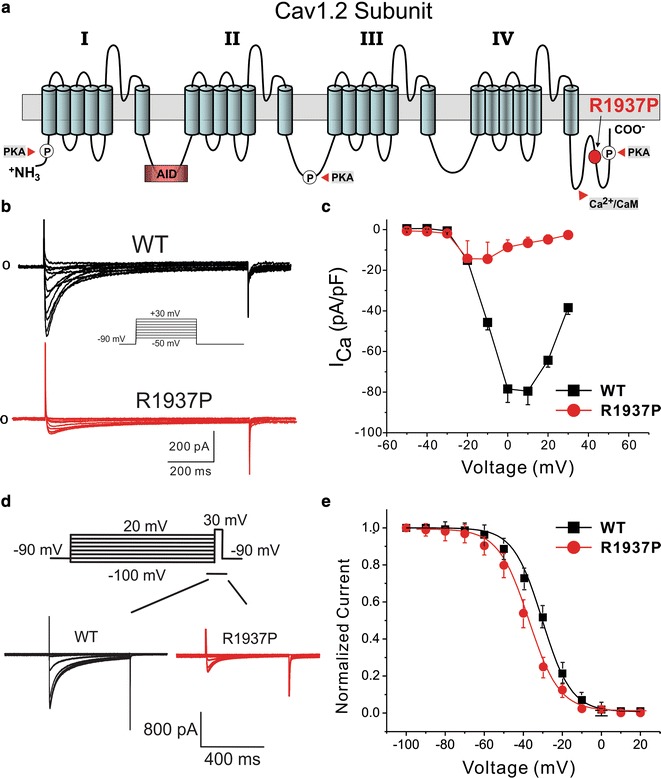
Fig. 4.

Functional expression studies of the R1973P mutant in CACNA1C. a 2D Topology of the mutated site. b Representative whole-cell calcium current traces (ICa) recorded in TSA201 cells transfected with WT-CACNA1Cand R1973-CACNA1C co-expressed with CACNB2b and CACNA2D1 subunit genes. ICa traces recorded are in response to the voltage clamp protocol shown at the top inset. c Current–voltage relationship (I–V curve) of WT and R1973P variant. Each point data represents the mean ± SEM of 14 experiments. d Representative ICa recorded in response to the voltage clamp protocol shown at the inset on top in TSA201 cells expressing WT or R1973P mutant in CACNA1C. Peak currents were normalized to their respective maximum values and plotted against the conditioning potential to obtain the steady-state inactivation curves. e R1973P mutant channels showed a significantly more negative mid-inactivation potential compared to WT channels. R1973P (red circle) V 1/2 = −34.1 ± 0.3 mV, K = 6.5 ± 0.3 vs; WT (black squares) V 1/2 = −30.3 ± 0.3 mV, K = 7.4 ± 0.2. Each point data represents the mean ± S.E.M of 4–6 experiments
