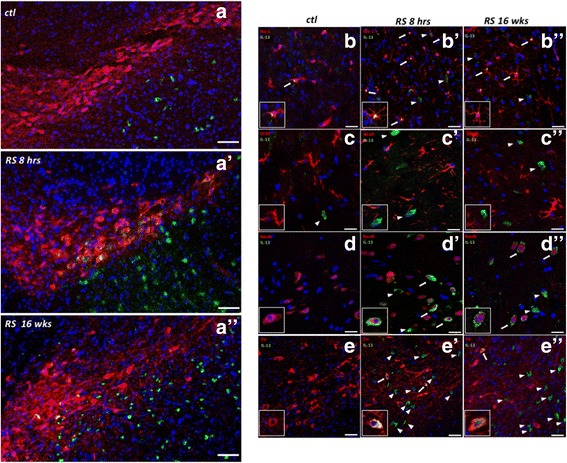
Fig. 3.

Mapping the location of IL-13 production in the substantia nigra. (A–A″) Representative pictures of immunofluorescent staining of IL-13 (green) in the SN of non-stressed (top), 8 h of RS (center) and after 16 weeks of RS (bottom); showing that RS elevates IL-13 expression in both the SNc and the SNr. (Pictures representative of a n = 3 experiment; scale bars: 0.5 mm; blue: DAPI). (B–B″, C–C″, D–D″, E–E″) Representative pictures of double immunofluorescence of IL-13 (green) with Iba-1, GFAP, NeuN, and TH (red), respectively, in control condition, 8 h of RS, and 16 weeks of RS. Arrows: co-localization of IL-13 and the specific cell type marker; arrowheads: IL-13 signal without co-localization with the cell type marker. IL-13 co-localizes (arrows) with microglia (Iba-1, Fig. B–B″), neurons (NeuN, Fig. D–D″), and dopaminergic cells (TH, Fig. E–E″). No co-staining was found in astrocytes (GFAP, Fig. C–C″). (scale bar: 200 μm in A–A″, 50 μm in B–E″; blue: DAPI)
