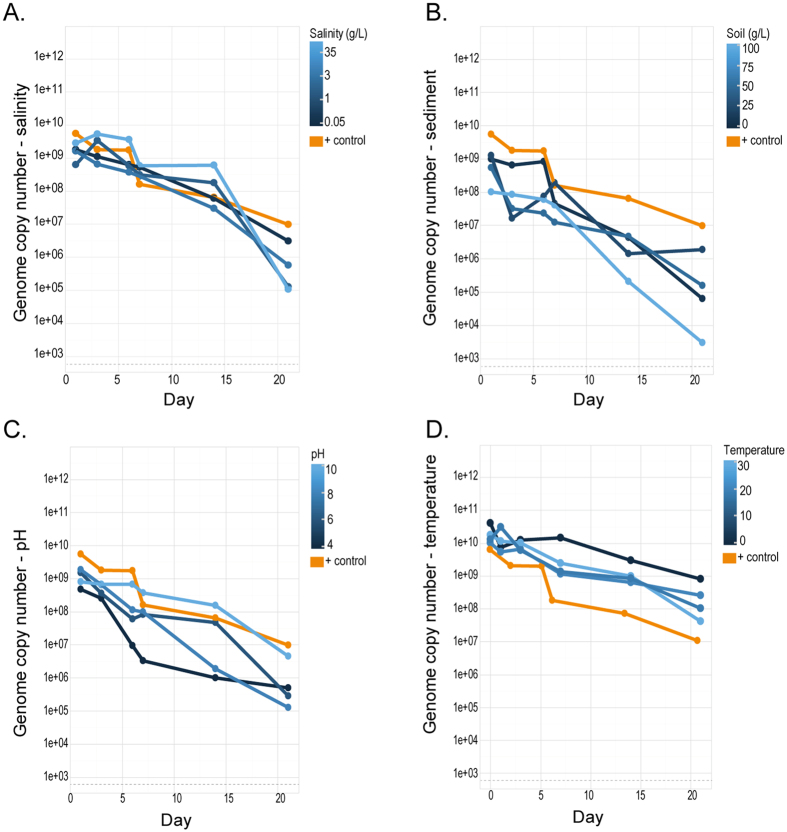
Figure 2.
qPCR results for the detection of EHV DNA extracted from initial water samples taken from distilled water (1 L) under different conditions (A) salinity (0.05, 1, 3, 35 g/L), (B) sediment (7.5, 25, 50 and 100 g/L), (C) pH (pH: 4, 6, 8, 10), (D) temperature (4, 20, 30 °C) spiked with EHV-1(103.5 TCID50/ml). The experiment was run over 21 days and samples were taken at six time points (days). Yellow lines indicate the positive control of EHV-1 and distilled water. Detection limit of EHV-1 is represented with a dotted grey line. All values shown represent GCN of EHV-1.

