
Figure 7. Kinetic release profile of DOX from HIDPPNPs under light exposure in vitro.
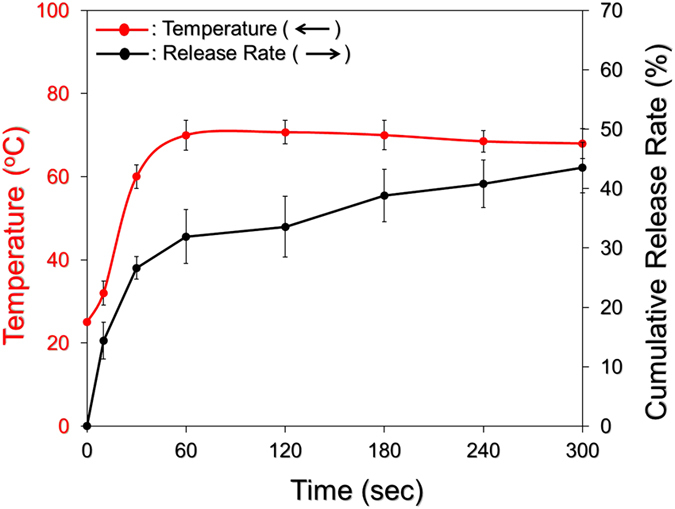
The cumulative release curve of DOX under NIR light irradiation was established by measuring the concentrations of DOX in the supernatant through UV-Vis spectrometry (λ = 485 nm) after operating for 0, 10, 30, 60, 120, 180, 240, and 300 sec. The light illumination was performed using an 808-nm laser with an intensity of 6 W/cm2. The red curve indicates the temperature of the medium at each time point when the concentration of released DOX was detected. The values are the mean ± s.d. (n = 3).