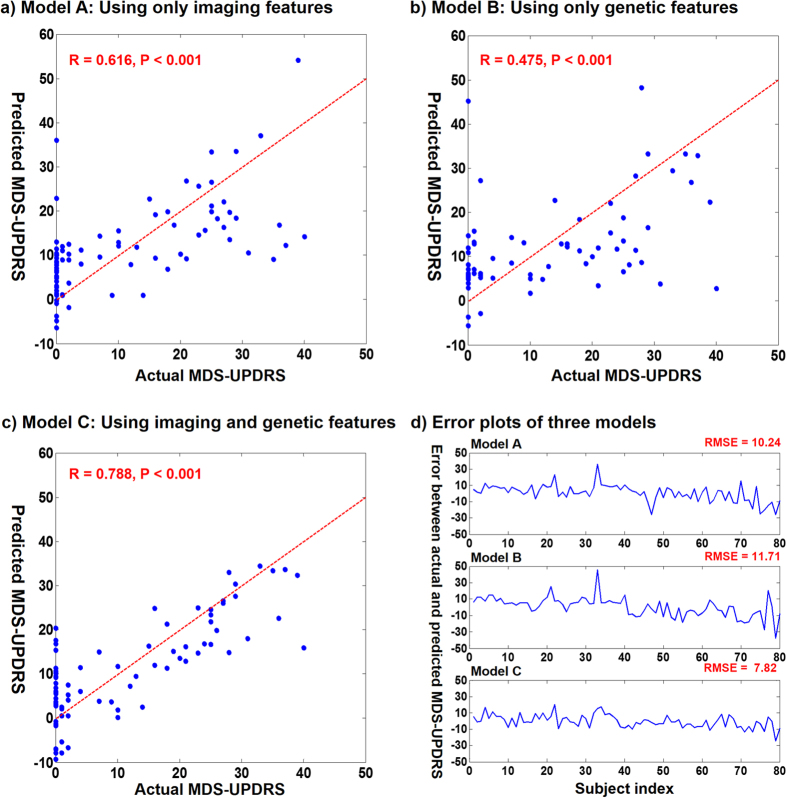
Figure 1. Plots of actual and predicted MDS-UPDRS for three prediction models.
Sub-figures (a,b and c) show actual and predicted MDS-UPDRS from Models A (1), B (2), and C (3), respectively. The dashed line indicates the identity line (i.e., actual score = predicted score). (d) shows error plots of the three models.

