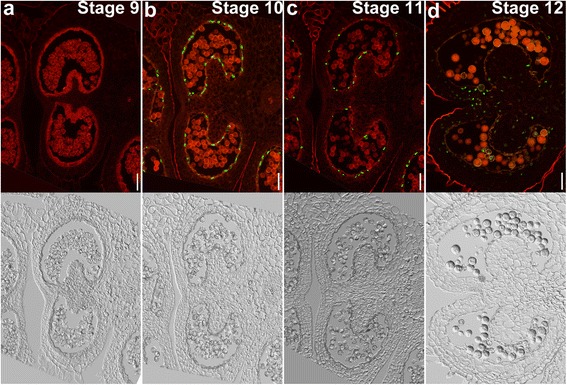
Fig. 6.

Tapetal PCD during tomato anther development by TUNEL assays. a–d Fluorescence microscope of cross-sections of tomato anthers at stage 9 (a), stage 10 (b), stage 11 (c), and stage 12 (d). Green fluorescence indicates TUNEL-positive signals while red fluorescence indicates PI staining. Corresponding transmission images are placed below the fluorescence images. Bars, 50 μm
