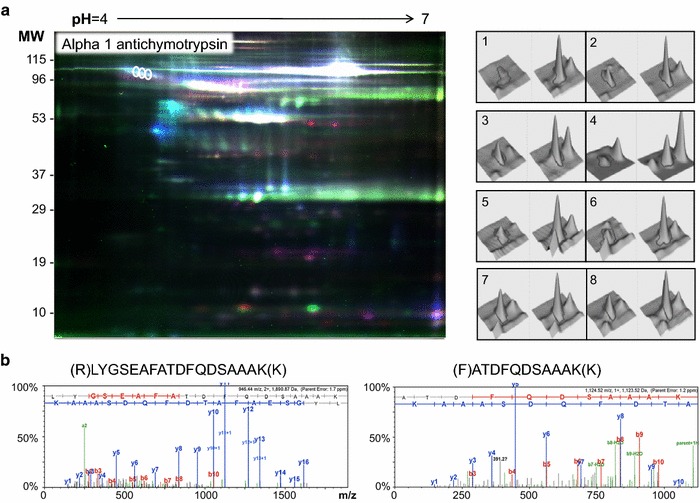
Fig. 2.

2D-DIGE results. a Representative fluorescence DIGE image, showing the differentially expressed spots corresponding to AACT. On the right, the spot intensity in 3D of one of the three spots corresponding to AACT is shown. The differences between controls and patients were consistent in the 8 gels studied. b Fragmentation spectra of the proteotypic peptides used for AACT identification by MALDI-MS/MS. The fragments of the y ion series are shown in blue, while the b ion series are shown in red
