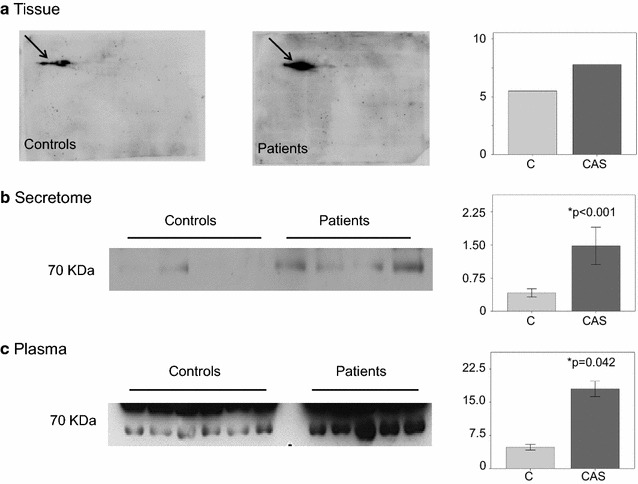
Fig. 4.

Validation of the AACT protein in Western Blots. a Bidimensional immunodetection analysis of tissue samples in which differences in the expression of the isoforms is indicated by arrows. b Immunodetection of the secretome samples. The band was more intense in the patient group than in the controls. c Immunodetection of the plasma samples. Again, the band in the plasma from the patients was more intense than in the controls. Quantification by densitometry is also shown in the figure and the AACT levels are clearly higher in the CAS patients in all cases
