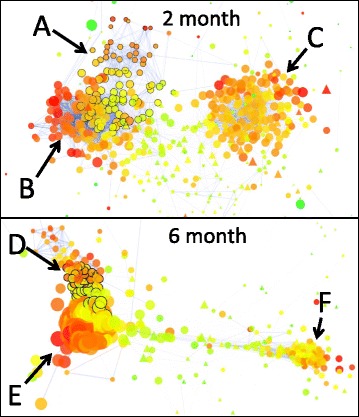
Fig. 5.

Undirected, edge-weighted gene expression/metabolite correlation networks generated from the first 2 months data (top) and all 6 months (bottom). Correlations R2 ≥ 0.700 were considered for network generation. Only nodes connected with 1 or more other nodes are included and, to highlight areas of connection, edges become more transparent as they diminish towards R2 = 0.700. Circles and triangles represent metabolite and gene clusters, respectively. Node size indicates neighborhood connectivity; larger nodes are connected to more closely correlated neighbors. Node color indicates clustering coefficient with green = 0, yellow = 0.64, and red = 1. Letters designate regions of interest including first neighbors (R2 ≥ 0.700) of CTOL—pre-symptomatic (a) or methanol-- symptomatic (d) networks with black outlined nodes, metabolites and transcripts linked with tissue that will develop healthy (b and e), and metabolites and transcripts with relatively elevated levels in unripe peel (c and f)
