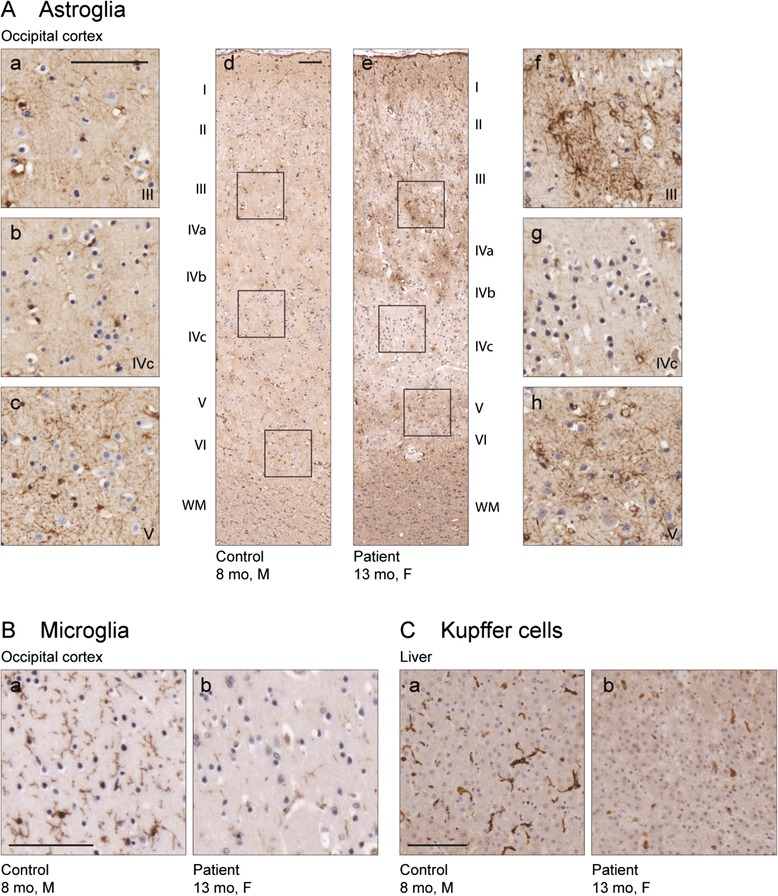
Fig. 5.

Patient brain and liver immunohistochemistry. (a) Increased immunoreactivity for the astroglial marker glial fibrillary acidic protein (GFAP) and change in the morphology of astroglial cells, two classical signs for astroglial activation, can be seen in the occipital cortex of the patient (e-h), but not in control brain (a-d). Activation is less pronounced in the lower part of the layer IV (g, b for ctrl), compared to the stronger activation in the upper part of the layer IV (f, a for ctrl) and layers V-VI (h, c for ctrl). The areas in the insets a-c and f-h are shown in figures d and e, respectively. (b) Immunostaining for the microglial marker IBA1 reveals loss of microglial cells and their processes in the cortex of the Lund patient (a) compared to the control (b). (c) Similar loss of Kupffer cells can be seen in the patient liver (a) and control (b). Scale bars 100 μm
