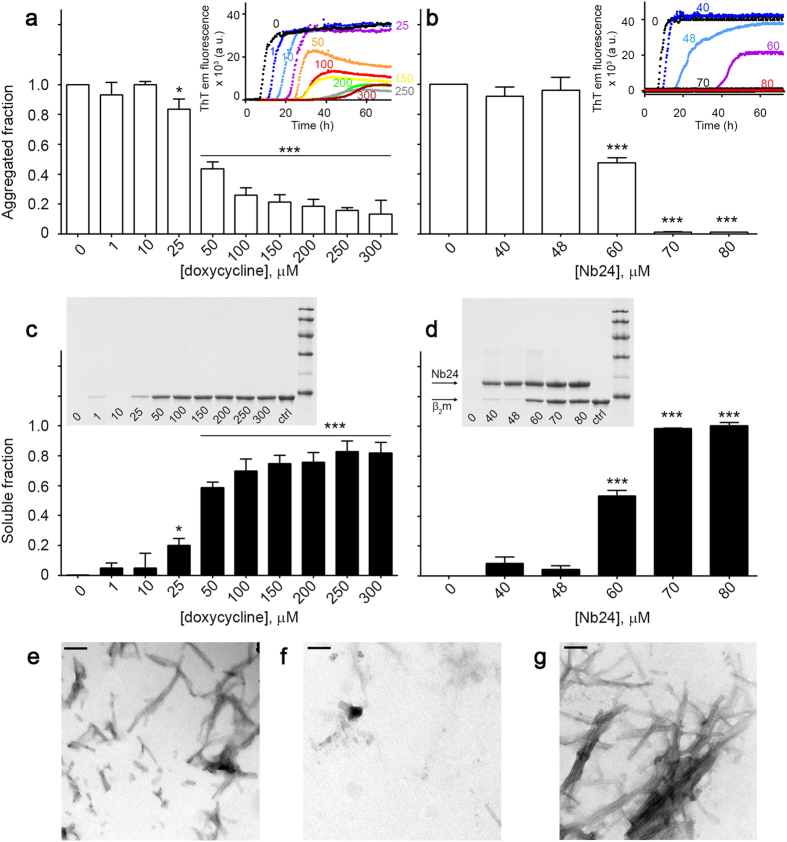
Figure 1. Inhibition of D76N β2m fibrillogenesis.
(a) D76N β2m fibrillogenesis monitored by ThT emission fluorescence in the absence and in the presence of increasing concentrations of doxycycline or (b) Nb24 nanobody. Data were normalized to the thioflavin T signal plateau at ~72 h after the initiation of each reaction in the samples without any ligand. Means ± SD of three replicates are shown. Insets, representative sets of ThT emission fluorescence curves with the corresponding ligand concentration (μM). (c,d) Analysis of the soluble fraction remaining in the supernatant after 72 h in the absence and in the presence of doxycycline or Nb24 respectively. After centrifugation, supernatants were analyzed by SDS 15% homogenous PAGE; intensities of electrophoretic bands corresponding to monomeric β2m were quantified and normalized with the intensity of the band of the protein before aggregation. Means ± SD of three replicates are shown. T-test analysis: *P < 0.05; ***P < 0.001 versus sample containing D76N β2m only. Insets, SDS-PAGE are shown for each ligand with their corresponding concentrations. Protein before aggregation (ctrl) and marker proteins (14.4, 20.1, 30.0, 45.0, 66.0, and 97.0 kDa) are included. (e–g) Negatively stained transmission electron microscopy of the pellet harvested at the end of the fibrillogenesis (~72 h) in the presence of 300 μM doxycycline (e), 80 μM of Nb24 (f) or in the absence of any ligand (g) respectively (scale bar, 100 nm).

