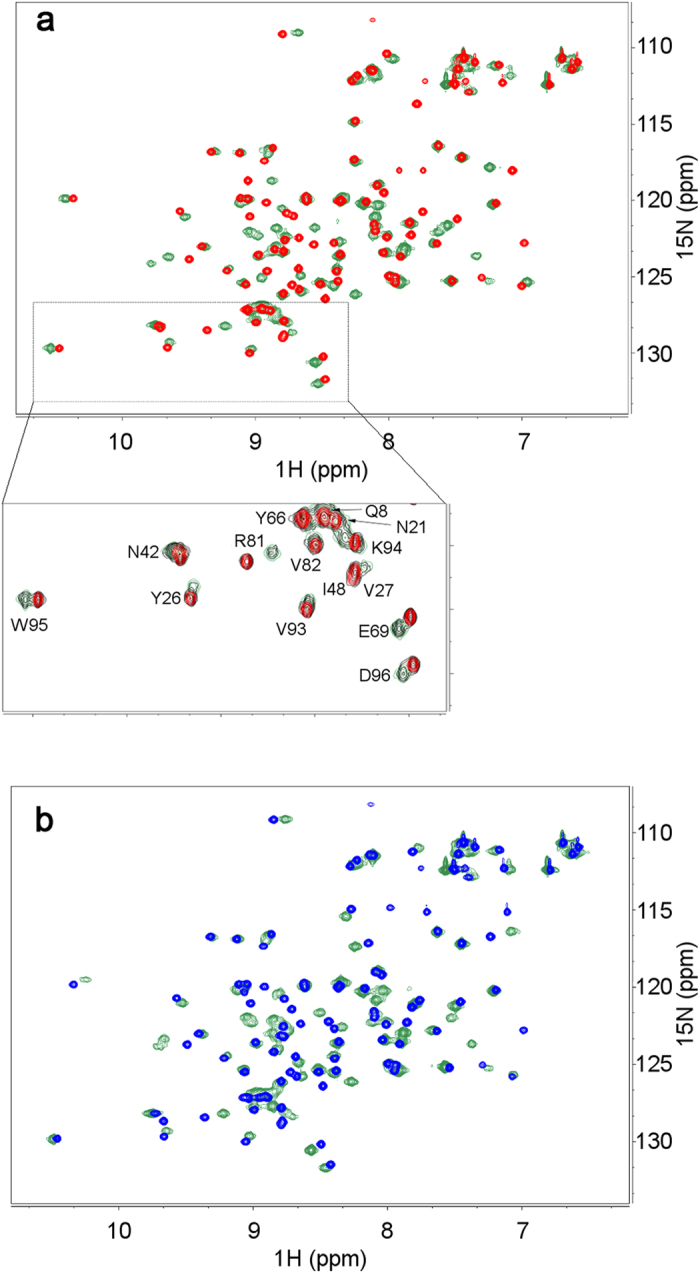
Figure 3. Effect of Nb24 binding on HSQC spectra of wild type and D76N β2m.

15N-1H HSQC map overlays of 70 μM wild type (a) and 75 μM D76N β2m (b) without and with unlabeled Nb24 nanobody (140 and 165 μM, respectively). In both panels the green contours are relative to the spectra with Nb24. All spectra were recorded at 600 MHz (1H frequency), 25 °C in 25 mM phosphate buffer (pH* 7.2). Nb24 forms a stable complex with both β2m species and the typical pattern observed along titration is depicted in the zoomed portion. The expanded region in panel (a) reports relevant contour overlay of Nb24 titration, namely at wild type β2m/Nb24 ratio of 1:0 (red), 1:0.7 (black), 1:2 (green), to illustrate the typical features of complexation induced perturbation. The single-letter code assignments refer to the 15N-1H correlation of the backbone amides, except for W95 that concerns side-chain (indole Nε1-Hε1). For the sake of clarity, labels are omitted for A15 and L23 that overlap Y66 and Q8 peaks, respectively.
