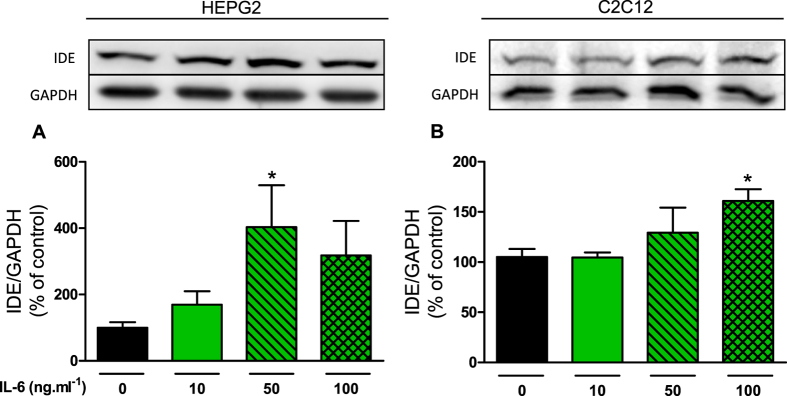
Figure 3. Effects of IL-6 incubation on IDE protein expression in HEPG2 and C2C12 cells.
Protein expression of IDE in HEPG2 (A) and C2C12 (B) cells and its representative immunoblottings images. The cells were incubated at 0, 10, 50 and 100 ng ml−1 IL-6, during 3 h. Data are presented as the mean ± S.E.M. n = 3–4. *p ≤ 0.05 vs 0 ng ml−1 IL-6.

